


공식 공급 업체
200 이상의 소프트웨어 개발처와 판매 계약을 맺은 공인 디스트리뷰터로서 합법적인 라이선스를 제공합니다.
모든 브랜드 보기.
영어로 계속 읽기:
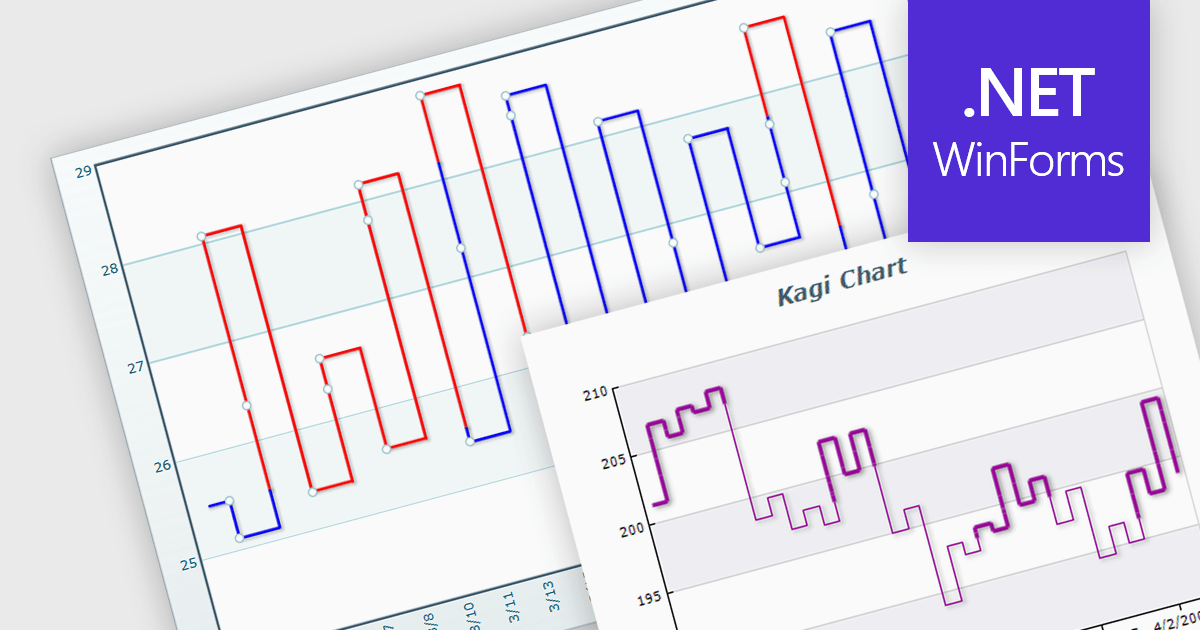
A Kagi chart is a type of financial chart used to track price movements, with a focus on significant trends and reversals rather than minor fluctuations, to inform stock purchasing decisions. It features a series of vertical lines that reflect changes in price. The direction of these lines shifts only when the price moves by a predetermined amount, known as the reversal amount. Thin lines indicate that the price has fallen below the previous low while thick lines indicate that the price has surpassed the previous high. By filtering out minor price fluctuations it emphasises substantial price movements, offering a clearer perspective on market trends.
Several WinForms chart components provide Kagi charts, including:
For an in-depth analysis of features and price, visit our WinForms charts comparison.
전화 : 00798 14 800 6332
팩스 : +1 770 250 6199


