


공식 공급 업체
200 이상의 소프트웨어 개발처와 판매 계약을 맺은 공인 디스트리뷰터로서 합법적인 라이선스를 제공합니다.
모든 브랜드 보기.
영어로 계속 읽기:
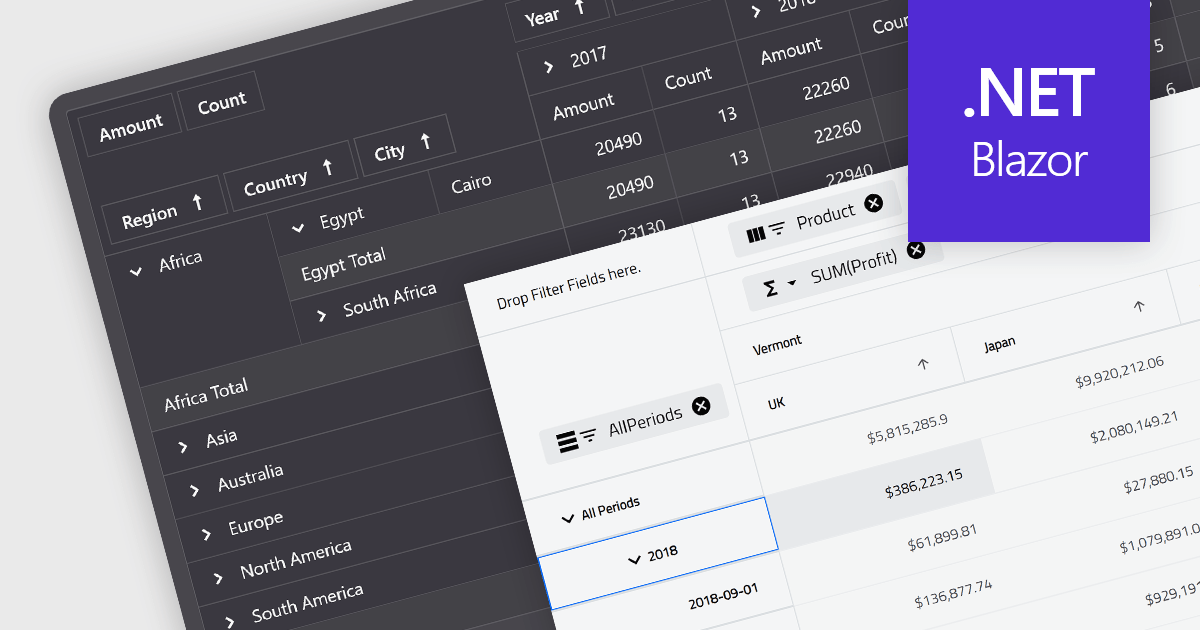
A pivot grid is a powerful data analysis tool that allows you to dynamically summarize and reorganize large datasets. By dragging and dropping fields, you can quickly create a new table that groups and calculates values based on different categories, revealing trends and patterns within your data. This interactive functionality makes pivot grids ideal for gaining insights and informing data-driven decisions. Common use cases include financial analysis, marketing campaign evaluation, and sales performance exploration.
Several Blazor UI suites feature a pivot grid control including:
For an in-depth analysis of features and price, visit our Blazor UI suites comparison.
전화 : 00798 14 800 6332
팩스 : +1 770 250 6199


