


공식 공급 업체
200 이상의 소프트웨어 개발처와 판매 계약을 맺은 공인 디스트리뷰터로서 합법적인 라이선스를 제공합니다.
모든 브랜드 보기.
영어로 계속 읽기:
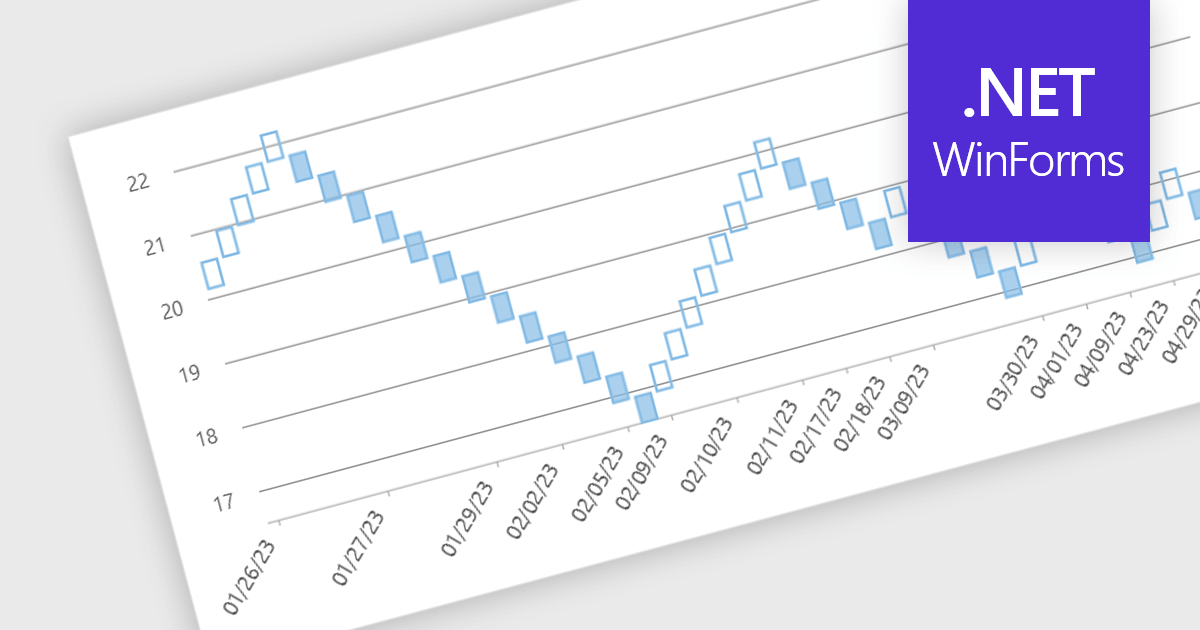
Renko charts are specialized financial charts that represent price movements with fixed-sized bricks, filtering out minor price fluctuations to highlight significant trends. These charts are particularly useful for identifying key support and resistance levels, making trend direction clearer by eliminating noise from the data. A primary benefit of Renko charts lies in their ability to simplify the visualization of market trends and price patterns, aiding developers in creating sophisticated financial applications that require precise and clear representation of market behavior. By using Renko charts, developers can enhance the analytical capabilities of their applications, providing users with powerful tools to make informed trading decisions.
Several .NET WinForms Chart controls offer a Renko chart including:
For an in-depth analysis of features and price, visit our comparison of .NET WinForms Chart controls.
전화 : 00798 14 800 6332
팩스 : +1 770 250 6199


