


공식 공급 업체
200 이상의 소프트웨어 개발처와 판매 계약을 맺은 공인 디스트리뷰터로서 합법적인 라이선스를 제공합니다.
모든 브랜드 보기.
영어로 계속 읽기:
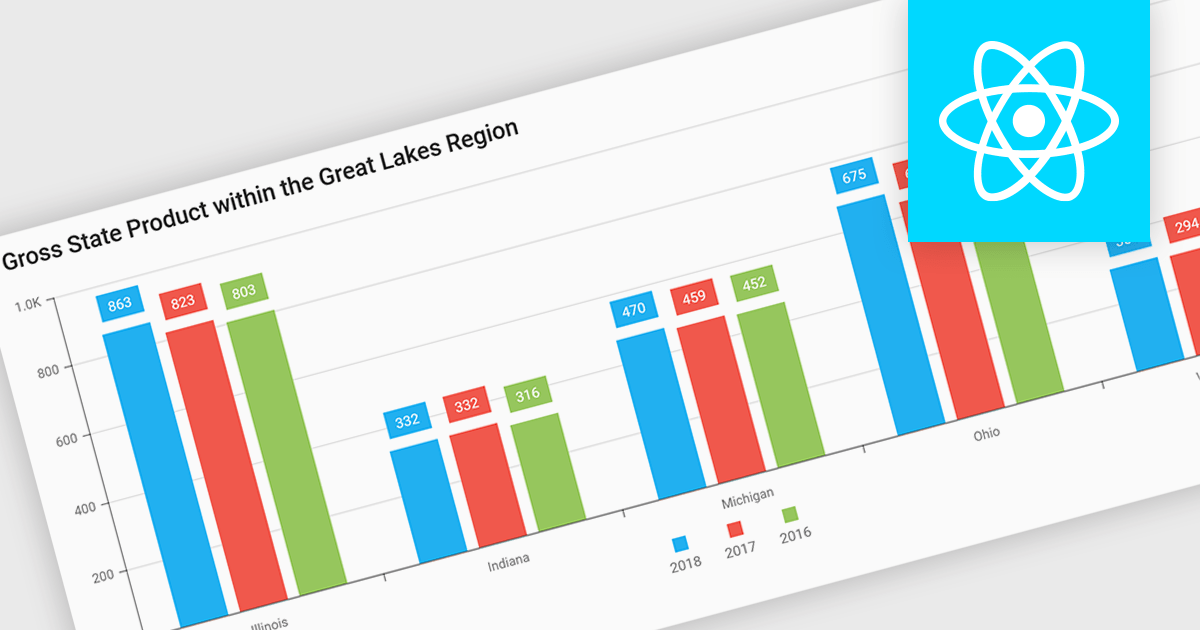
Bar and column charts, though sometimes referred to interchangeably, are vital tools for visualizing data within software applications. Their simple format, with bars representing categories and their lengths proportional to corresponding values, allows users to quickly grasp comparisons between different data sets. This makes them ideal for dashboards displaying sales figures across regions, project management tools tracking task completion rates, or any scenario where users need to compare metrics at a glance. Their effectiveness lies in their ability to present complex information in a clear and concise manner, facilitating informed decision-making within software applications.
Several React Chart controls offer column and bar charts including:
For an in-depth analysis of features and price, visit our React Chart controls comparison.
전화 : 00798 14 800 6332
팩스 : +1 770 250 6199


