


공식 공급 업체
200 이상의 소프트웨어 개발처와 판매 계약을 맺은 공인 디스트리뷰터로서 합법적인 라이선스를 제공합니다.
모든 브랜드 보기.
영어로 계속 읽기:
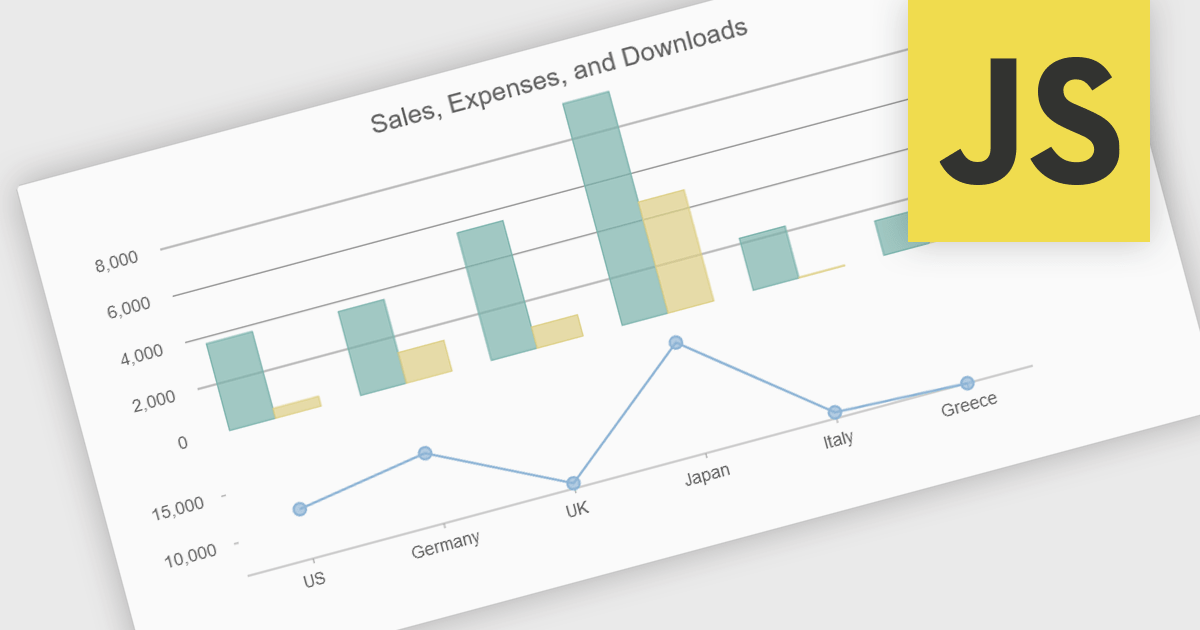
Combination charts (also known as combo charts) are visualizations that integrate multiple chart types, such as bar, line, and area charts, within a single display. This approach allows developers to show varied data sets and relationships in a cohesive, comprehensive manner, facilitating more nuanced data analysis and comparison. The primary benefits include their ability to convey complex information efficiently, their flexibility in showcasing different data trends simultaneously, and their enhanced readability for end-users who need to interpret diverse metrics at a glance. This versatility makes combination charts an invaluable tool for presenting multifaceted data insights in dynamic, interactive web applications.
Several JavaScript / HTML5 chart controls offer combination charts including:
For an in-depth analysis of features and price, visit our comparison of JavaScript / HTML5 Chart Controls.
전화 : 00798 14 800 6332
팩스 : +1 770 250 6199


