


공식 공급 업체
200 이상의 소프트웨어 개발처와 판매 계약을 맺은 공인 디스트리뷰터로서 합법적인 라이선스를 제공합니다.
모든 브랜드 보기.
영어로 계속 읽기:
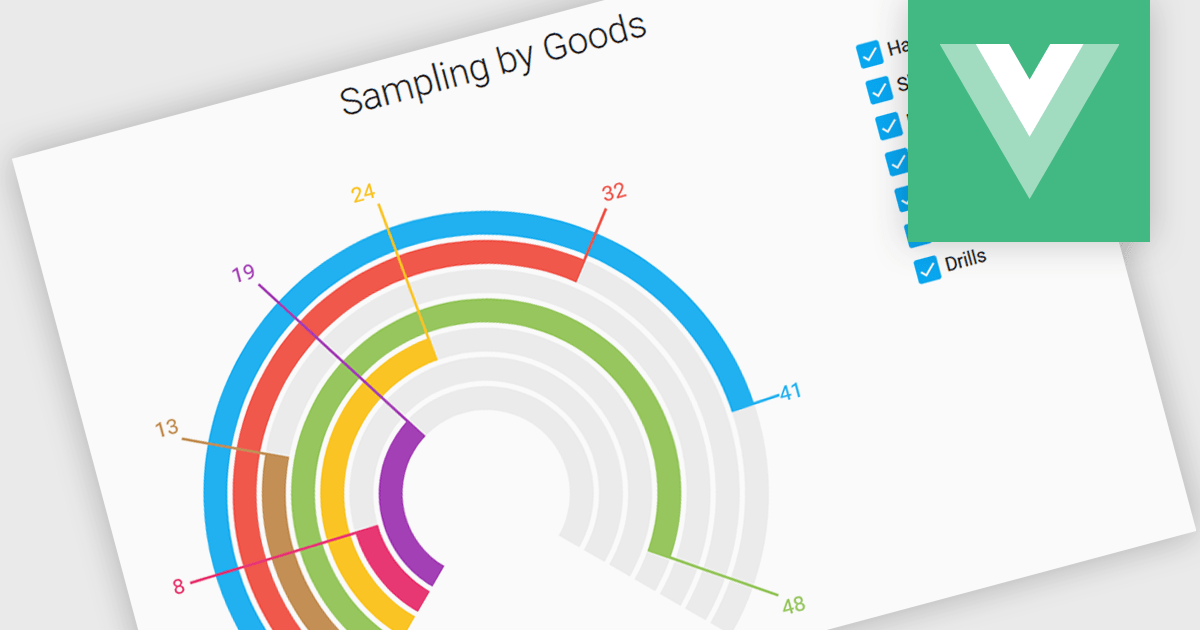
Gauge controls are visual components employed in software development to represent numerical data in a graphical format. They effectively communicate quantitative information at a glance, aiding rapid decision-making. Common types include radial, linear, and circular gauges. Primarily utilized in dashboards and monitoring interfaces, gauges excel at displaying performance metrics, system health indicators, and real-time data trends. Their intuitive design enhances user experience by providing immediate insights into key performance indicators (KPIs) and facilitating efficient analysis.
Several Vue.js UI suites offer gauge controls including:
For an in-depth analysis of features and price, visit our Vue.js UI suites comparison.
전화 : 00798 14 800 6332
팩스 : +1 770 250 6199


