


공식 공급 업체
200 이상의 소프트웨어 개발처와 판매 계약을 맺은 공인 디스트리뷰터로서 합법적인 라이선스를 제공합니다.
모든 브랜드 보기.
영어로 계속 읽기:
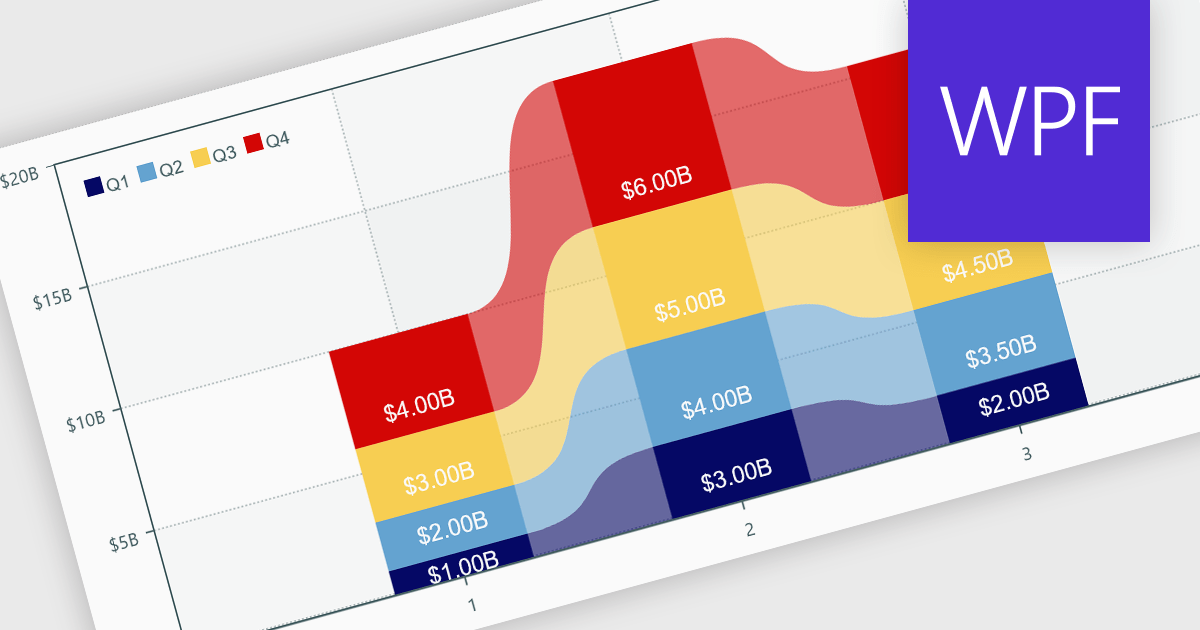
Charts within reports are graphical representations of data that allow users to visually interpret trends, comparisons, and patterns. They can take various forms, such as bar charts, line charts, or pie charts, and are typically integrated into dashboards or reporting tools to provide clear insights at a glance. By simplifying data visualization, charts enhance user experience and make it less taxing for users to understand complex information. Charts can be dynamically updated with real-time data, allowing for more responsive and insightful reporting in applications.
Several .NET WPF reporting controls offer support for charts including:
For an in-depth analysis of features and price, visit our comparison of .NET WPF Reporting controls.
전화 : 00798 14 800 6332
팩스 : +1 770 250 6199


