


공식 공급 업체
200 이상의 소프트웨어 개발처와 판매 계약을 맺은 공인 디스트리뷰터로서 합법적인 라이선스를 제공합니다.
모든 브랜드 보기.
영어로 계속 읽기:
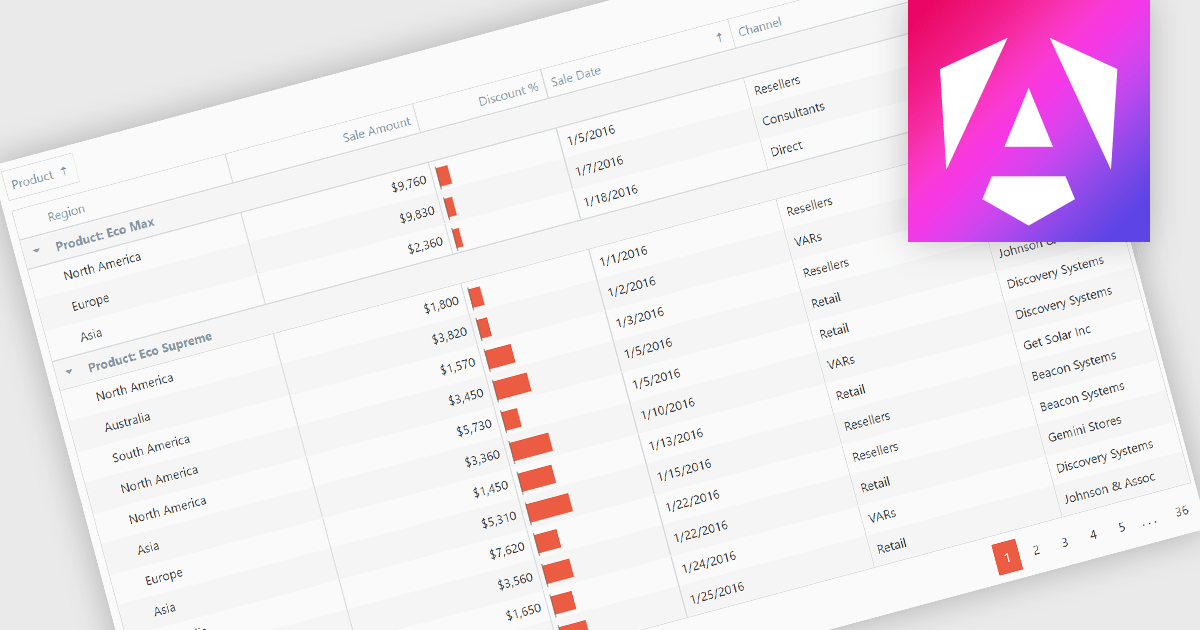
Grouping grid data organizes the data into distinct groups within a grid-like structure. It involves visually clustering related data points together, often using color, shading, or borders, to enhance pattern recognition and make complex datasets more understandable. This method is useful for identifying trends, outliers, and correlations within large amounts of information.
Several Angular grid controls offer support for grouping including:
For an in-depth analysis of features and price, visit our Angular grid controls comparison.
전화 : 00798 14 800 6332
팩스 : +1 770 250 6199


