


공식 공급 업체
200 이상의 소프트웨어 개발처와 판매 계약을 맺은 공인 디스트리뷰터로서 합법적인 라이선스를 제공합니다.
모든 브랜드 보기.
영어로 계속 읽기:
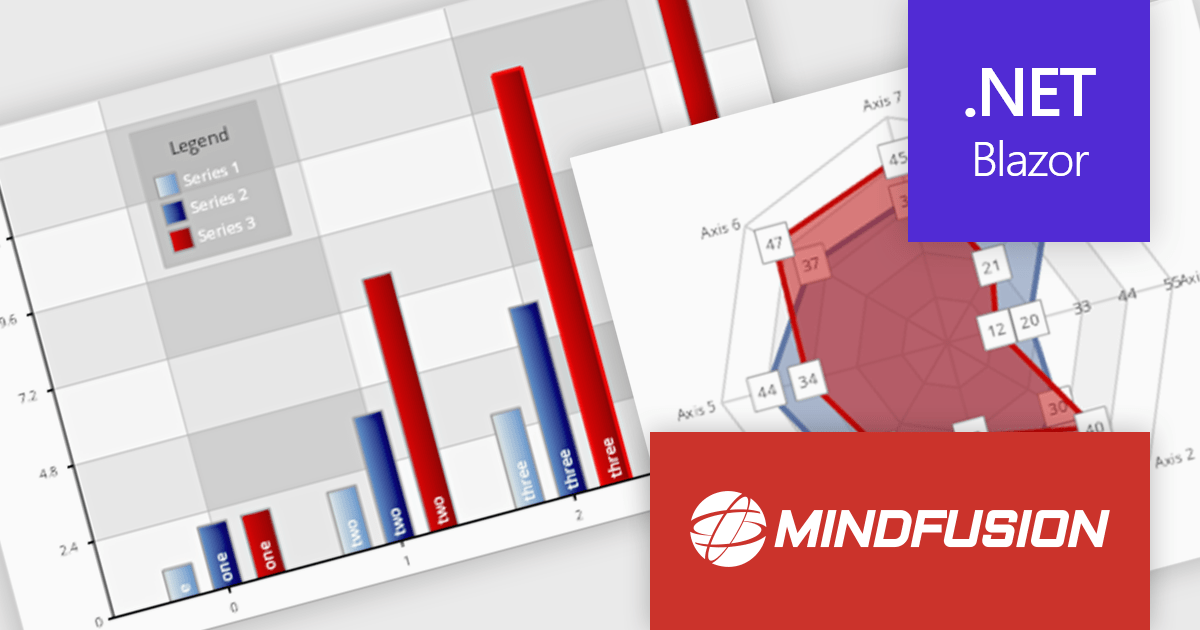
MindFusion.Charting for .NET Blazor is a robust solution that allows developers to effortlessly incorporate a diverse array of interactive and customizable charts and dashboards into Blazor applications. Supporting a wide range of chart types, from basic bar and line charts to more complex visualizations, it simplifies the creation of data-driven web applications. With flexible styling, user-friendly APIs, and smooth rendering, this library is perfect for building dynamic and visually engaging charting solutions in Blazor projects.
MindFusion Charting for .NET Blazor is ideal for building interactive, data-driven applications where dynamic visualization is key. It can be used for dashboards, reports, financial data analysis, performance tracking, and real-time monitoring. With its wide range of chart types, customization options, and user interaction features like pan, zoom, and hit testing, it enables developers to create intuitive, visually appealing interfaces for a variety of industries, including finance, healthcare, education, and business intelligence.
MindFusion.Charting for .NET Blazor is licensed per developer and is available as a perpetual license with 1 year subscription and support. See our MindFusion.Charting for .NET Blazor licensing page for full details.
For more information, visit our MindFusion.Charting for .NET Blazor product page.
전화 : 00798 14 800 6332
팩스 : +1 770 250 6199


