


공식 공급 업체
200 이상의 소프트웨어 개발처와 판매 계약을 맺은 공인 디스트리뷰터로서 합법적인 라이선스를 제공합니다.
모든 브랜드 보기.
영어로 계속 읽기:
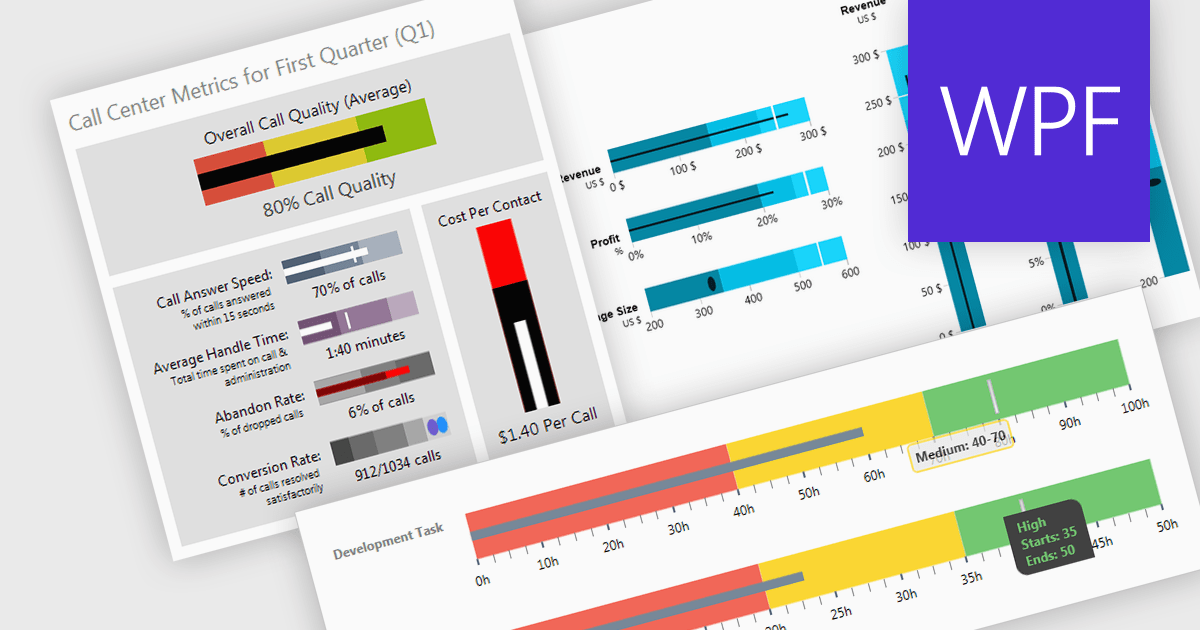
A bullet chart (or bullet graph) is a streamlined bar chart that effectively conveys key performance metrics in relation to targets. It features a single bar representing the main value, overlaid with shaded regions indicating qualitative ranges (e.g., "poor," "average," "good"), and a line marking the target. This minimalist design offers a clear, at-a-glance assessment of performance, making it well-suited for dashboards and reports where space is limited and focus on essential metrics is paramount.
Several WPF charting components support bullet graphs:
For an in-depth analysis of features and price, visit our comparison of WPF charting components.
전화 : 00798 14 800 6332
팩스 : +1 770 250 6199


