


공식 공급 업체
200 이상의 소프트웨어 개발처와 판매 계약을 맺은 공인 디스트리뷰터로서 합법적인 라이선스를 제공합니다.
모든 브랜드 보기.
영어로 계속 읽기:
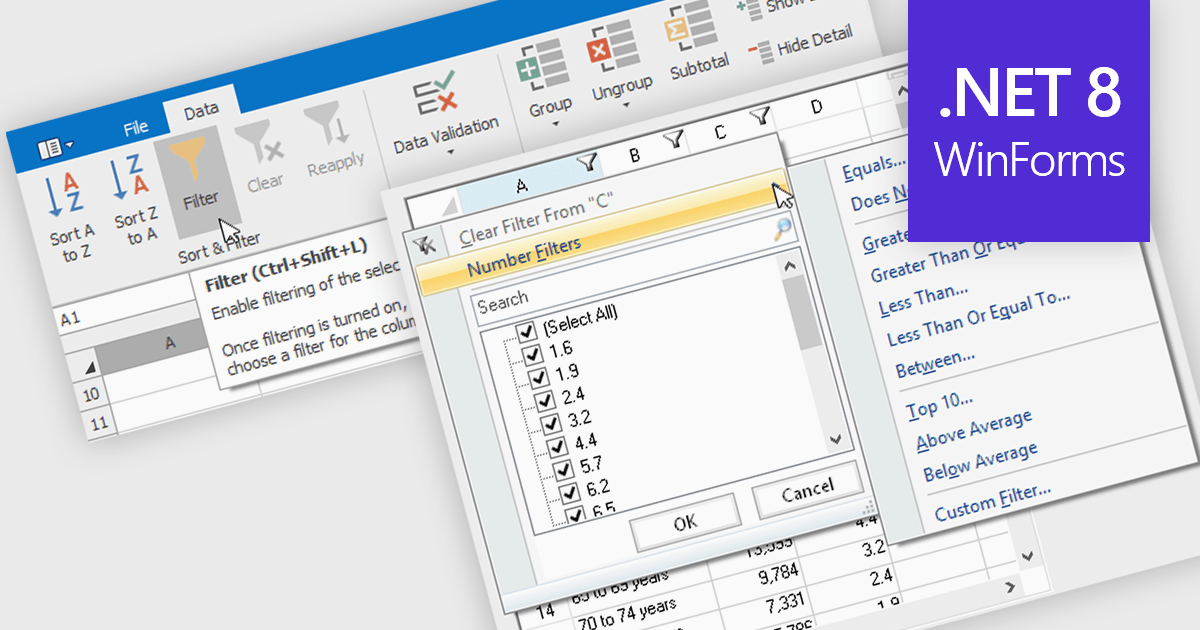
Data filtering and grouping allow spreadsheet users to efficiently organize and analyze information by categorizing and refining it. Filtering allows users to display only the data that meets specific criteria, reducing irrelevant information and focusing on key data points. Grouping, on the other hand, consolidates related rows or columns, facilitating hierarchical data organization and summarization. Together, these features enhance data manipulation capabilities by simplifying complex datasets, improving readability, and allowing for more efficient data analysis. This functionality supports productivity by providing a more structured view of data, making it easier for developers to interpret and work with extensive datasets.
Many .NET 8 WinForms spreadsheet controls contain data filtering and grouping including:
For an in-depth analysis of features and price, visit our comparison of .NET 8 WinForms spreadsheet controls.
전화 : 00798 14 800 6332
팩스 : +1 770 250 6199


