


공식 공급 업체
200 이상의 소프트웨어 개발처와 판매 계약을 맺은 공인 디스트리뷰터로서 합법적인 라이선스를 제공합니다.
모든 브랜드 보기.
영어로 계속 읽기:
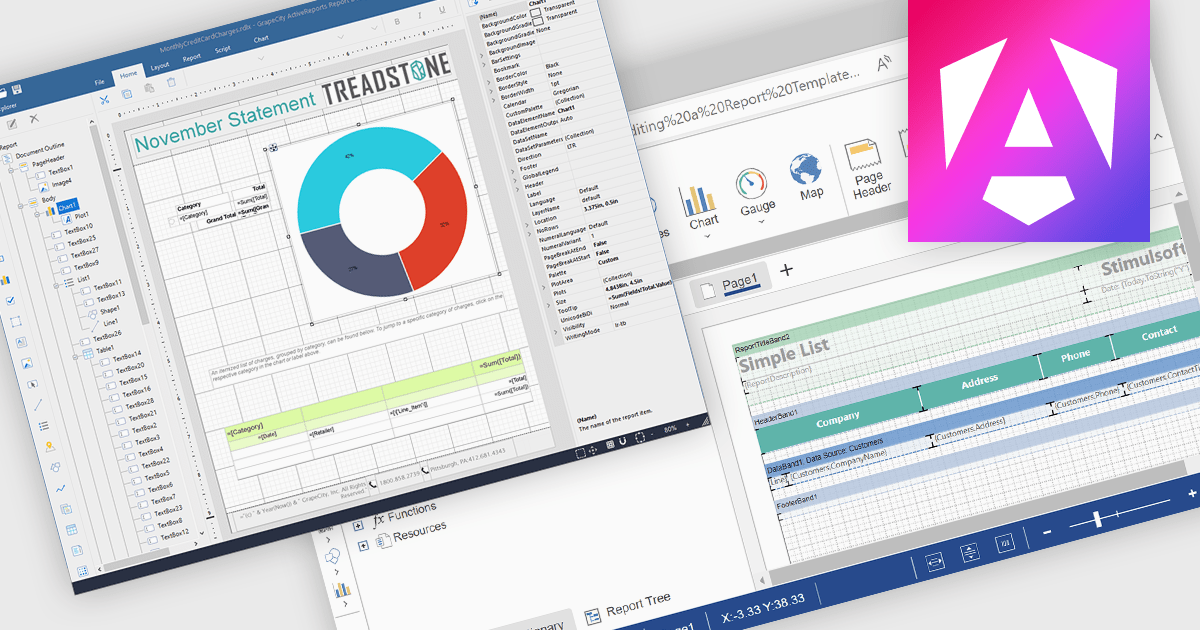
A Visual Report Designer in a reporting control enables users to create and customize data-rich reports through an intuitive, drag-and-drop interface. With ready-to-use templates, interactive elements, and direct data binding, it simplifies report creation while maintaining professional quality. Key benefits include real-time data updates, brand customization, and interactive filters, making it ideal for business intelligence tasks like financial dashboards, performance reports, and analytics summaries. This feature empowers teams to generate insights quickly and make data-driven decisions with ease.
Several Angular reporting controls offer visual report designer support including:
For an in-depth analysis of features and price, visit our Angular Reporting Controls comparison.
전화 : 00798 14 800 6332
팩스 : +1 770 250 6199


