


공식 공급 업체
200 이상의 소프트웨어 개발처와 판매 계약을 맺은 공인 디스트리뷰터로서 합법적인 라이선스를 제공합니다.
모든 브랜드 보기.
영어로 계속 읽기:
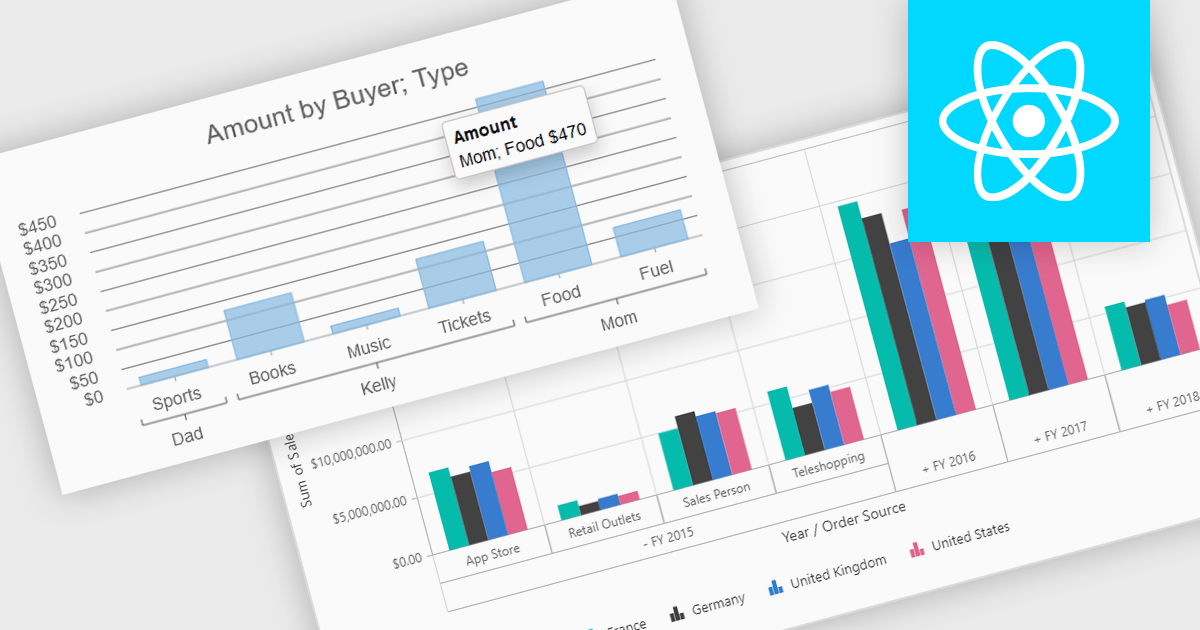
Pivot charts are dynamic visualization tools that enable users to interact with and analyze data in a highly flexible manner. They extend the capabilities of pivot tables by providing visual representations of aggregated data, making it easier to identify trends, patterns, and outliers. Key benefits include real-time updates, intuitive interactivity, and support for multi-dimensional data analysis, which simplifies complex datasets into actionable insights. Integrating pivot charts into your applications empowers end-users to explore and present data in a way that is both visually compelling and deeply informative.
Several React UI suites offer pivot chart components including:
For an in-depth analysis of features and price, visit our comparison of React UI Suites.
전화 : 00798 14 800 6332
팩스 : +1 770 250 6199


