


공식 공급 업체
200 이상의 소프트웨어 개발처와 판매 계약을 맺은 공인 디스트리뷰터로서 합법적인 라이선스를 제공합니다.
모든 브랜드 보기.
영어로 계속 읽기:
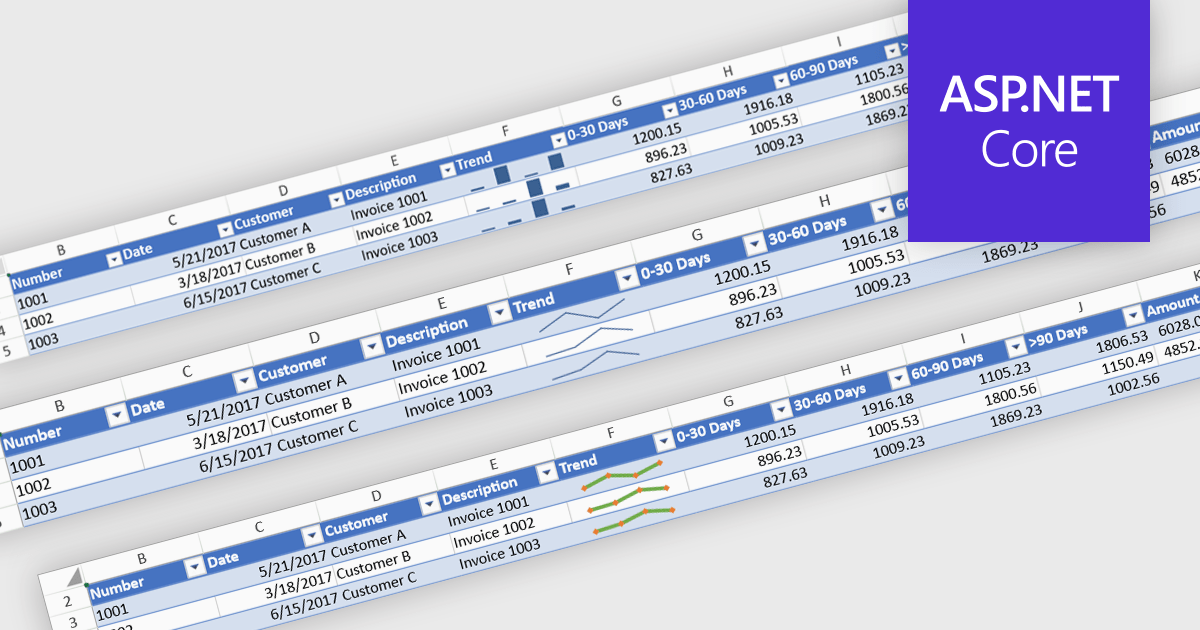
Sparklines are compact, embedded charts that provide a visual representation of data trends within individual spreadsheet cells. Unlike traditional charts, they do not require a separate charting area, making them ideal for summarizing data patterns, such as sales performance, stock trends, or operational metrics, in a space-efficient manner. These microcharts enhance readability and decision-making by offering a quick, at-a-glance view of trends without overwhelming users with excessive detail.
Several ASP.NET Core spreadsheet controls offer sparkline functionality including:
For an in-depth analysis of features and price, visit our ASP.NET Core spreadsheet controls comparison.
전화 : 00798 14 800 6332
팩스 : +1 770 250 6199


