


공식 공급 업체
200 이상의 소프트웨어 개발처와 판매 계약을 맺은 공인 디스트리뷰터로서 합법적인 라이선스를 제공합니다.
모든 브랜드 보기.
영어로 계속 읽기:
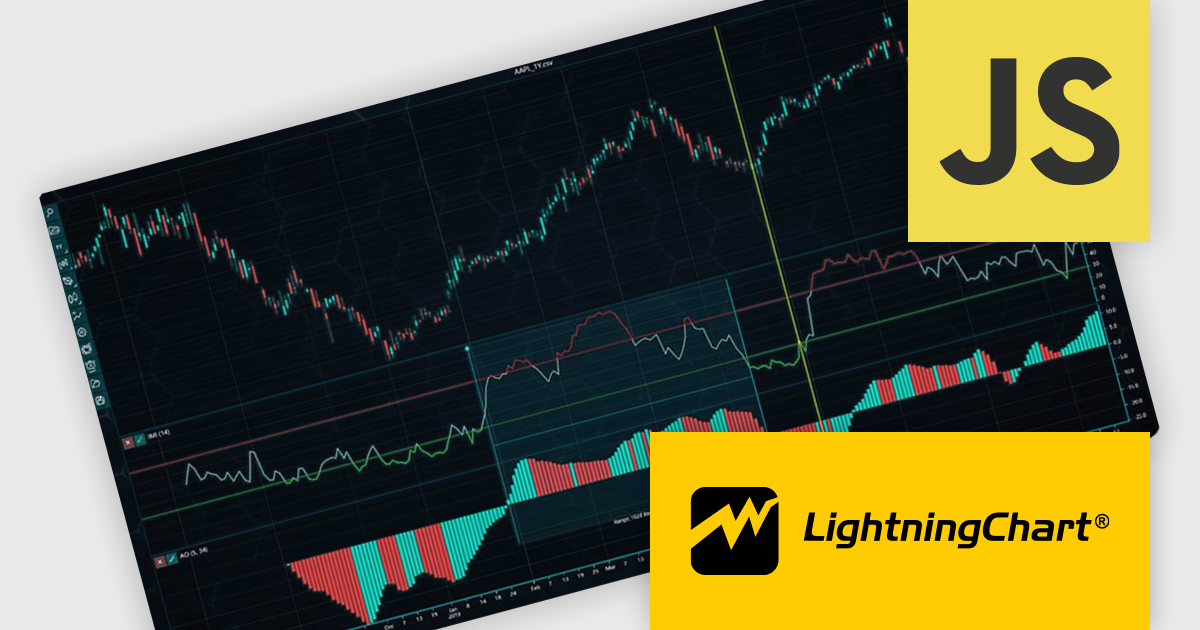
LightningChart JS Trader is a JavaScript/TypeScript library developed by LightningChart that specifically targets the creation of financial and trading applications. It provides high-performance, 2D, 3D, and real-time charting controls and a comprehensive suite of visualizations including candlestick, bar, line, and various technical indicators and drawing tools. This library enables software developers to craft interactive technical analysis tools without the need for server-side setup as it runs completely on the client device.
The LightningChart JS Trader v3 update introduces draggable splitter lines, enabling users to dynamically resize indicator segments and the main chart within a single view. This enhancement provides greater flexibility in data visualization, allowing developers to create a more customizable and user-friendly charting experience. By adjusting the layout interactively, users can allocate space efficiently based on analytical needs, improving readability and workflow efficiency. This update eliminates the need for separate charts, streamlining technical analysis and ensuring all relevant data remains accessible within a unified interface.
To see a full list of what's new in v3, see our release notes.
LightningChart JS Trader is licensed per developer and is available as an annual license with 1 year support. See our LightningChart JS Trader licensing page for full details.
For more information, see our LightningChart JS Trader product page.
전화 : 00798 14 800 6332
팩스 : +1 770 250 6199


