


공식 공급 업체
200 이상의 소프트웨어 개발처와 판매 계약을 맺은 공인 디스트리뷰터로서 합법적인 라이선스를 제공합니다.
모든 브랜드 보기.
영어로 계속 읽기:
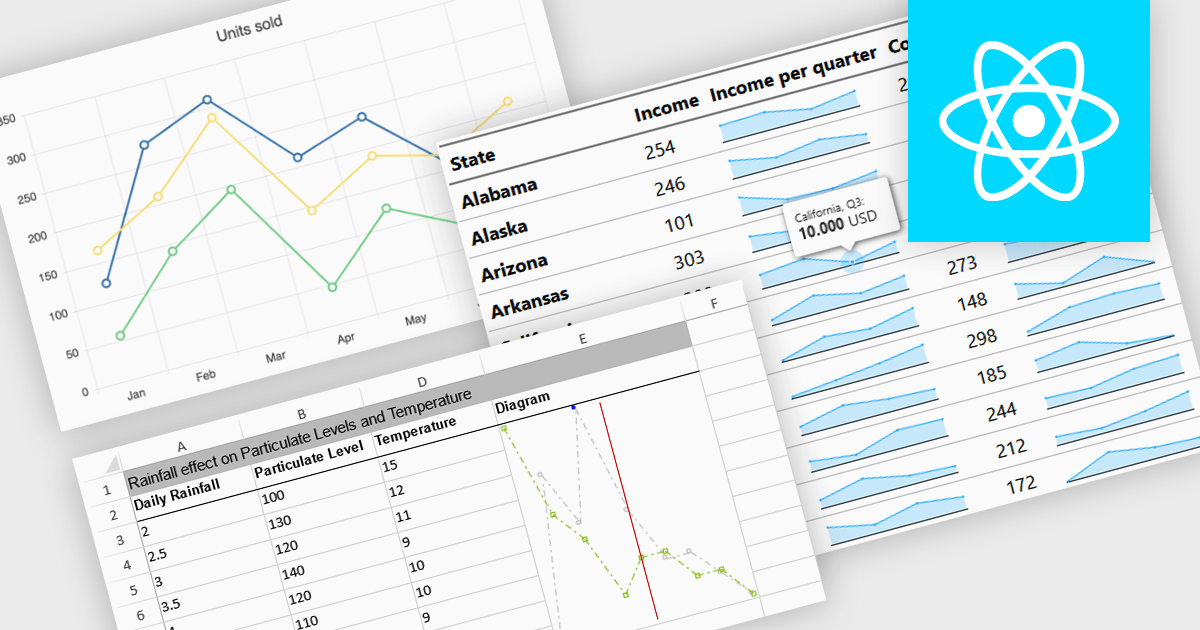
Sparkline charts are compact, data-rich visuals that display trends, patterns, and variations in a minimalistic format. Unlike traditional charts, they save space and seamlessly integrate into tables, dashboards, or reports for quick insights. These charts are particularly useful for identifying trends over time, monitoring real-time changes, and enhancing data readability. Common use cases include financial reports to track stock performance, sales dashboards to visualize revenue fluctuations, and performance monitoring tools to highlight system metrics. With their ability to quickly convey key insights in a visually intuitive manner, sparkline charts are an essential tool for data-driven decision-making.
Several React charts offer sparkline chart support, including:
For an in-depth analysis of features and price, visit our React chart comparison.
전화 : 00798 14 800 6332
팩스 : +1 770 250 6199


