


공식 공급 업체
200 이상의 소프트웨어 개발처와 판매 계약을 맺은 공인 디스트리뷰터로서 합법적인 라이선스를 제공합니다.
모든 브랜드 보기.
영어로 계속 읽기:
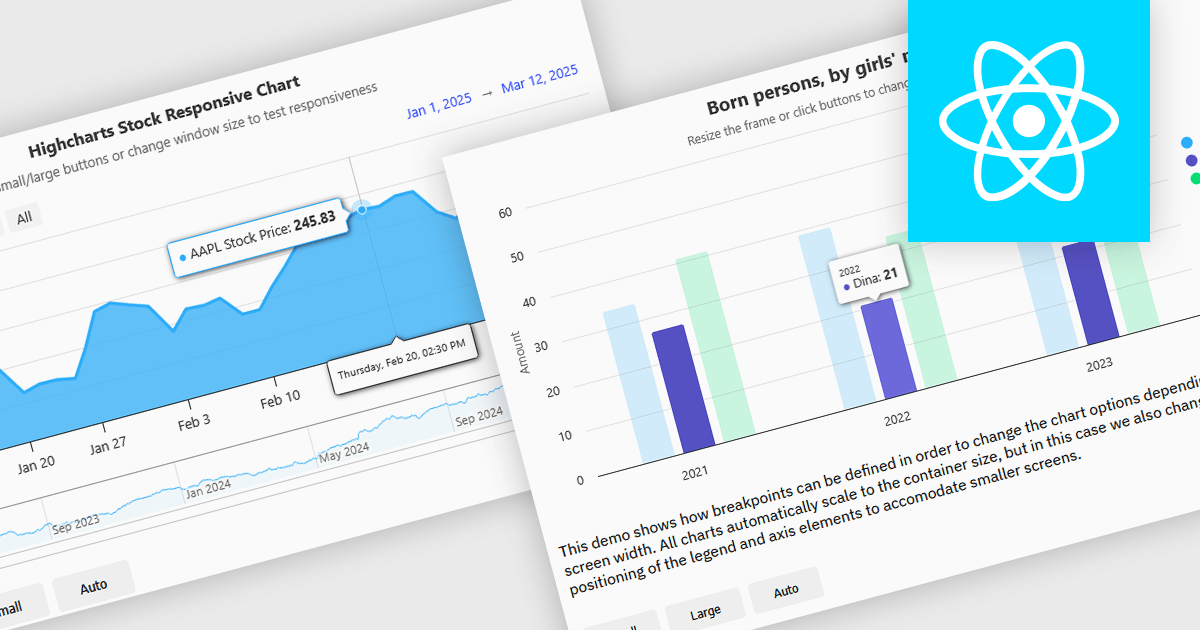
Responsive charts are dynamic data visualizations that automatically adjust to different screen sizes, resolutions, and devices, ensuring a seamless user experience across desktops, tablets, and mobile phones. By adapting elements such as labels, tooltips, legends, and axes, they enhance readability, improve accessibility, and maintain consistent data presentation. These charts optimize performance by efficiently rendering content and supporting interactive features like zooming, panning, and touch gestures. Developers use responsive charts in a wide range of applications, including financial reports, business intelligence dashboards, real-time monitoring systems, and interactive analytics tools, providing users with clear and accessible insights regardless of their device.
Several React charts offer responsive chart support, including:
For an in-depth analysis of features and price, visit our React chart comparison.
전화 : 00798 14 800 6332
팩스 : +1 770 250 6199


