


공식 공급 업체
200 이상의 소프트웨어 개발처와 판매 계약을 맺은 공인 디스트리뷰터로서 합법적인 라이선스를 제공합니다.
모든 브랜드 보기.
영어로 계속 읽기:
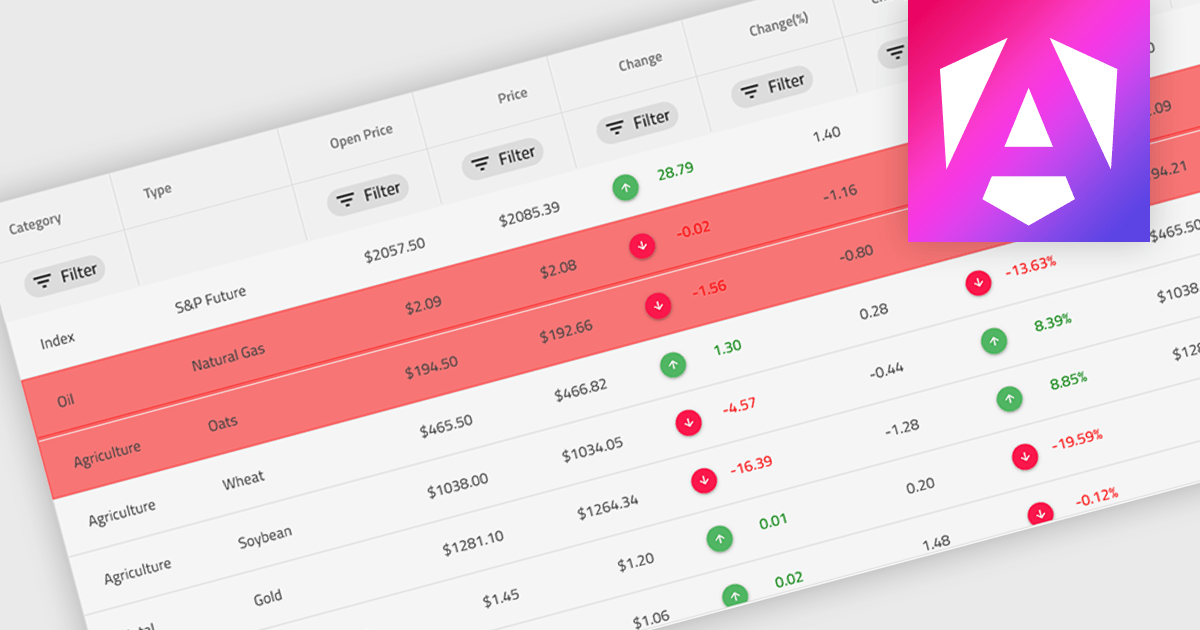
Conditional formatting in a grid refers to the dynamic application of visual styles—such as colors, icons, or font changes—to cells based on the values they contain or rules defined by the developer. This feature enables developers to visually differentiate data patterns, identify anomalies, or highlight critical values directly within a data grid without additional processing or user interaction. By presenting real-time visual cues tied to data content, conditional formatting enhances readability, supports quick analysis, and improves user decision-making, particularly in data-heavy applications where clarity and immediacy are essential.
Several Angular grid controls offer conditional formatting, including:
For an in-depth analysis of features and price, visit our comparison of Angular Grid controls.
전화 : 00798 14 800 6332
팩스 : +1 770 250 6199


