


공식 공급 업체
200 이상의 소프트웨어 개발처와 판매 계약을 맺은 공인 디스트리뷰터로서 합법적인 라이선스를 제공합니다.
모든 브랜드 보기.
영어로 계속 읽기:
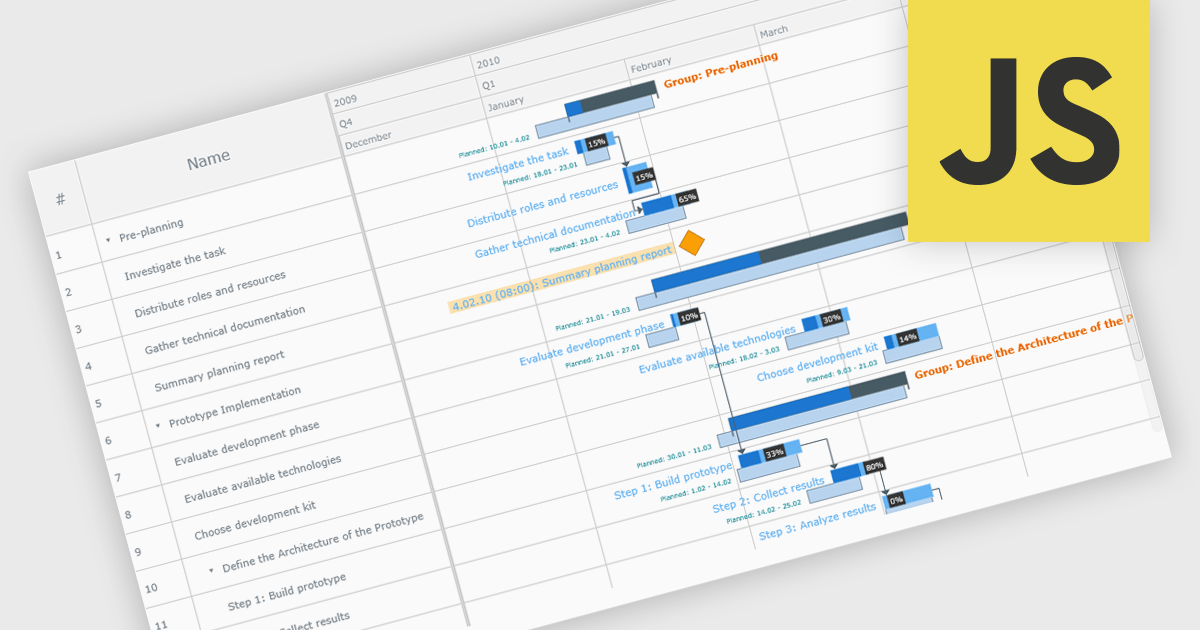
A Gantt chart is a visual project management tool that displays tasks or activities along a timeline, allowing teams to see the start and end dates, duration, and dependencies of each task within a project. Typically represented as horizontal bars across a calendar-based axis, Gantt charts provide a clear overview of project progress and help identify potential bottlenecks or scheduling conflicts. Gantt charts improve planning, scheduling, team coordination, and stakeholder transparency by clearly organizing tasks and timelines. They are especially valuable in complex projects, offering both macro and micro views to support informed decision-making and efficient execution.
Several JavaScript chart controls provide Gantt charts including:
For an in-depth analysis of features and price, visit our JavaScript chart controls comparison.
전화 : 00798 14 800 6332
팩스 : +1 770 250 6199


