


공식 공급 업체
200 이상의 소프트웨어 개발처와 판매 계약을 맺은 공인 디스트리뷰터로서 합법적인 라이선스를 제공합니다.
모든 브랜드 보기.
영어로 계속 읽기:
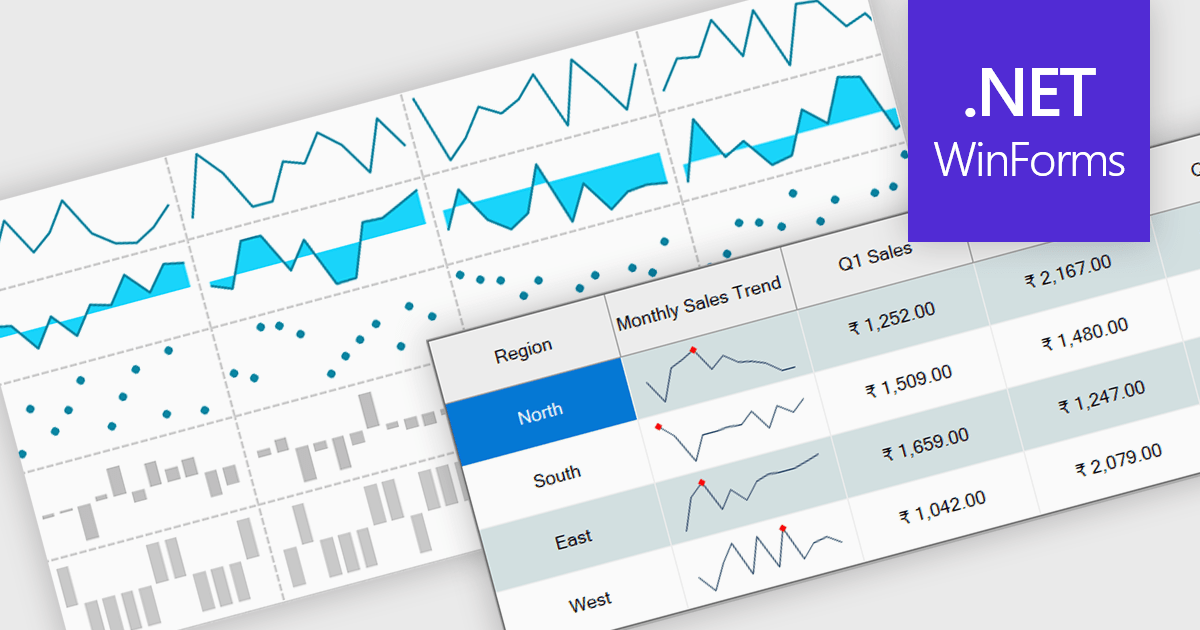
Sparklines are small embedded charts displayed within individual cells of a data grid or table, offering a compact and intuitive way to visualize trends, patterns and variations in data. Unlike traditional charts, sparklines are designed to fit alongside text or numerical values, providing immediate visual context without taking up additional space. This makes them ideal for high density dashboards and reports where space efficiency and quick interpretation are important. By enabling users to scan and compare trends across multiple rows at a glance, sparklines support faster decision making and improved data comprehension. Common use cases include tracking stock performance over time, visualizing monthly sales trends, monitoring temperature fluctuations or comparing website traffic across multiple pages directly within the grid.
Several .NET Winforms grid controls offer support for sparklines including:
전화 : 00798 14 800 6332
팩스 : +1 770 250 6199


