


공식 공급 업체
200 이상의 소프트웨어 개발처와 판매 계약을 맺은 공인 디스트리뷰터로서 합법적인 라이선스를 제공합니다.
모든 브랜드 보기.
영어로 계속 읽기:
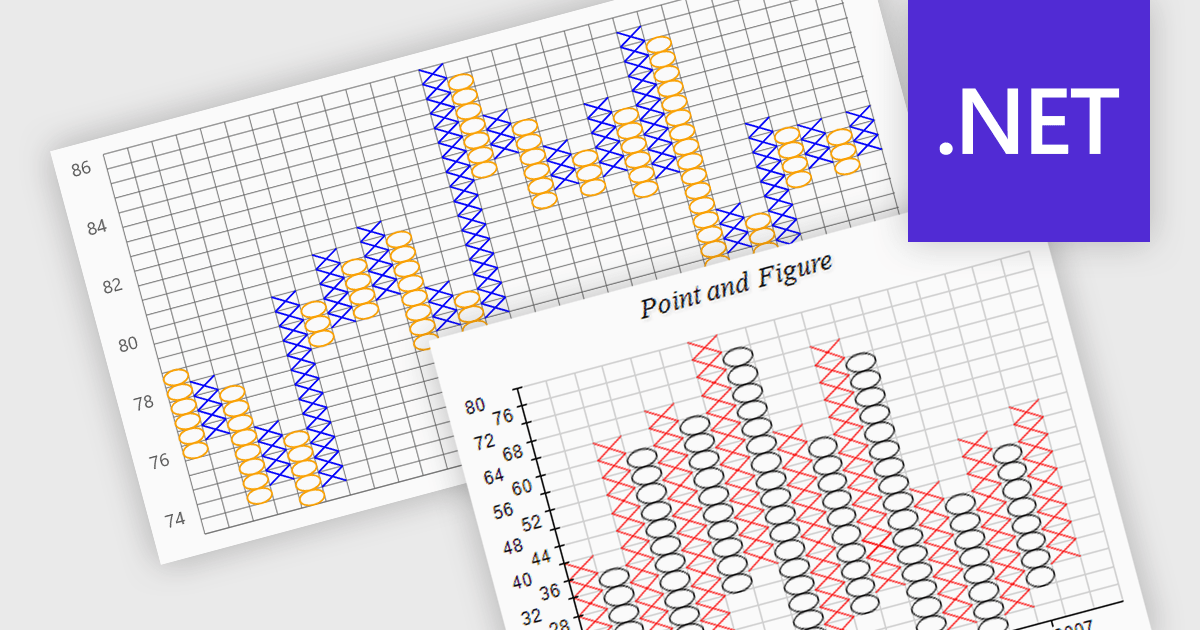
A point and figure (P&F) chart is a financial charting technique used to track price movements by plotting directional changes in price without reference to time. It focuses exclusively on significant price changes, filtering out minor fluctuations to highlight clear trends and reversals. Instead of plotting prices continuously, it uses columns of Xs and Os to represent rising and falling prices, respectively, based on predefined price increments. This chart type provides a straightforward view of supply and demand dynamics, making it particularly effective for identifying support and resistance levels, breakout patterns, and trend direction. Its simplicity helps traders and analysts focus on essential price action, reducing the noise found in traditional time-based charts.
Several .NET charting components provide you with point and figure charts, including:
For an in-depth analysis of features and price, visit our comparison of .NET chart components.
전화 : 00798 14 800 6332
팩스 : +1 770 250 6199


