


공식 공급 업체
200 이상의 소프트웨어 개발처와 판매 계약을 맺은 공인 디스트리뷰터로서 합법적인 라이선스를 제공합니다.
모든 브랜드 보기.
영어로 계속 읽기:
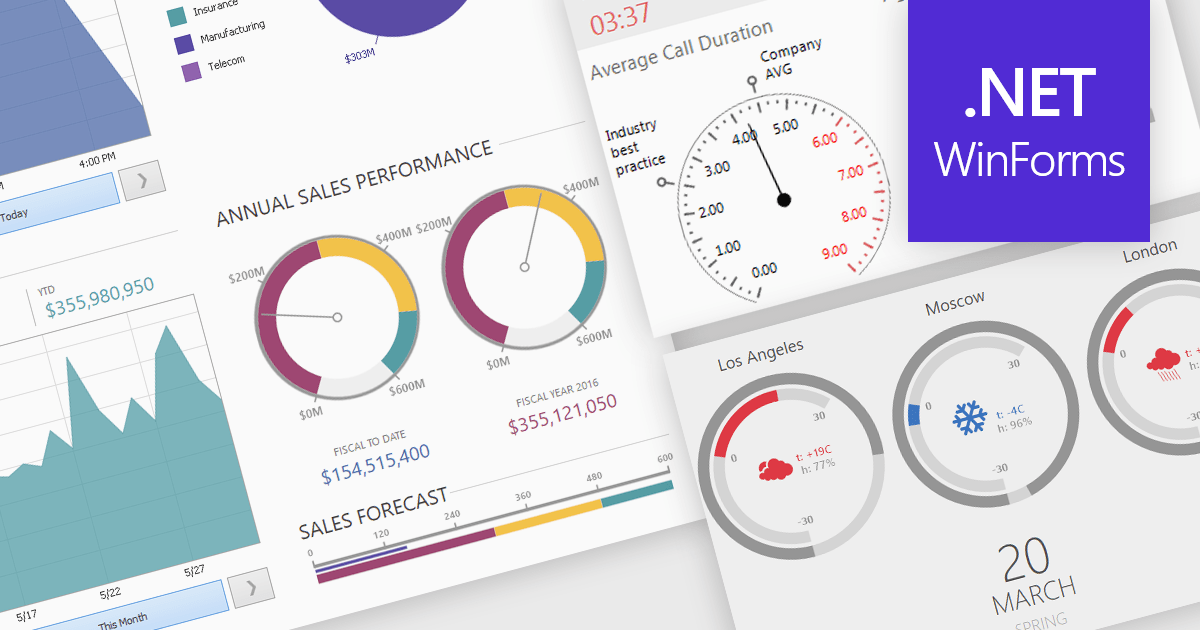
A gauge is a visual reporting element, such as a dial, meter, or progress bar, designed to display a single metric’s value in relation to defined targets or thresholds. For software developers, gauges offer a quick and intuitive way to present key performance indicators, making it immediately clear whether performance is on track, exceeding expectations, or requires attention. By transforming raw data into a simple, at-a-glance visual, gauges reduce the need for users to analyze complex tables or charts, improve the readability of dashboards and reports, and support faster, more informed decision-making.
Several .NET Winforms Reporting controls include Gauges including:
For an in-depth analysis of features and price, visit our comparison of .NET Winforms Reporting Controls.
전화 : 00798 14 800 6332
팩스 : +1 770 250 6199


