


공식 공급 업체
200 이상의 소프트웨어 개발처와 판매 계약을 맺은 공인 디스트리뷰터로서 합법적인 라이선스를 제공합니다.
모든 브랜드 보기.
영어로 계속 읽기:
SurveyJS Dashboard is a JavaScript UI component that visualizes survey responses in real time using interactive charts and tables, helping teams analyze data quickly and efficiently. It integrates with any JavaScript framework, including Angular, React, Vue, and vanilla JS. The dashboard renders data based on JSON schemas created in Survey Creator and filled with responses from the Form Library. Its flexible, backend-independent design allows integration with any custom backend. With a variety of chart types, it supports use cases such as customer feedback, employee surveys, and market research by turning raw data into clear visual insights.
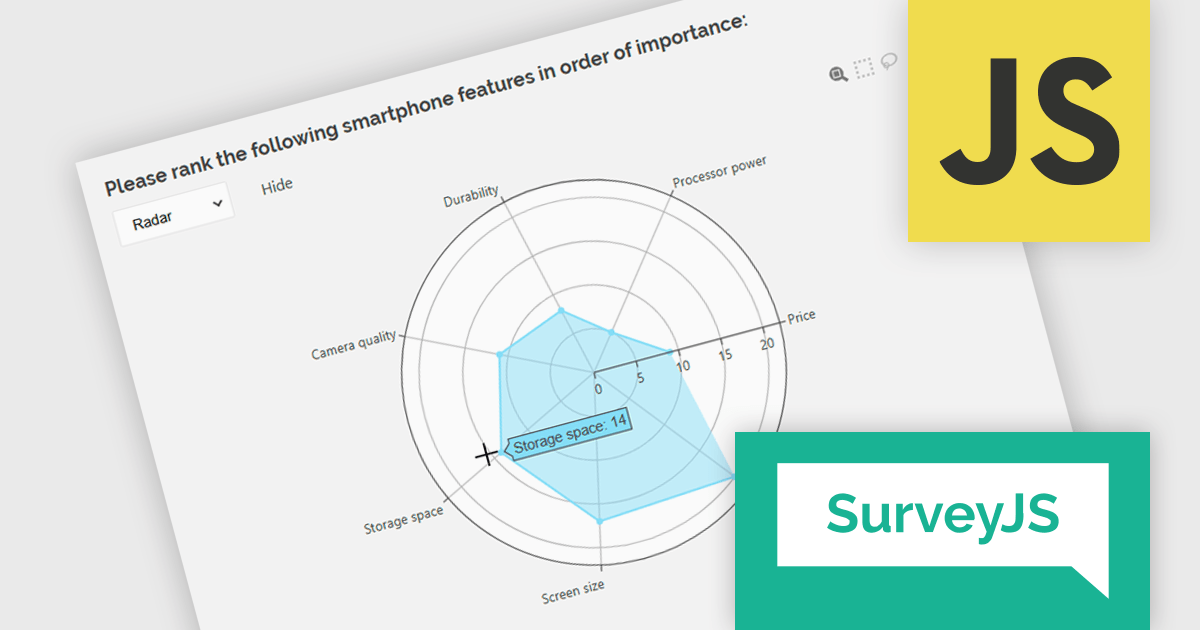
The SurveyJS Dashboard v2.3.0 update introduces support for radar charts, which developers can use to represent rank-based responses more intuitively, helping users gain clearer insights into survey data without additional configuration. This new chart type is automatically available for Ranking questions and can be selected directly from the chart type menu within the Dashboard.
To see a full list of what's new in version 2.3.0, see our release notes.
SurveyJS Dashboard is licensed per developer with a one-time payment for indefinite use. Access to updates and technical support is available through a subscription. See our SurveyJS Dashboard licensing page for full details.
Learn more on our SurveyJS Dashboard product page.
전화 : 00798 14 800 6332
팩스 : +1 770 250 6199


