


공식 공급 업체
200 이상의 소프트웨어 개발처와 판매 계약을 맺은 공인 디스트리뷰터로서 합법적인 라이선스를 제공합니다.
모든 브랜드 보기.
영어로 계속 읽기:
LightningChart JS is a high-performance JavaScript charting library that utilizes WebGL rendering and GPU acceleration to deliver exceptional performance for a wide range of data visualization needs. It is designed to handle large datasets and complex visualizations with ease, enabling developers to create interactive and visually appealing 2D and 3D charts. Ideal for applications demanding smooth real-time data updates, such as financial platforms, engineering tools, scientific research dashboards, and industrial monitoring systems, LightningChart JS provides a comprehensive API for customization and integration into web-based projects.
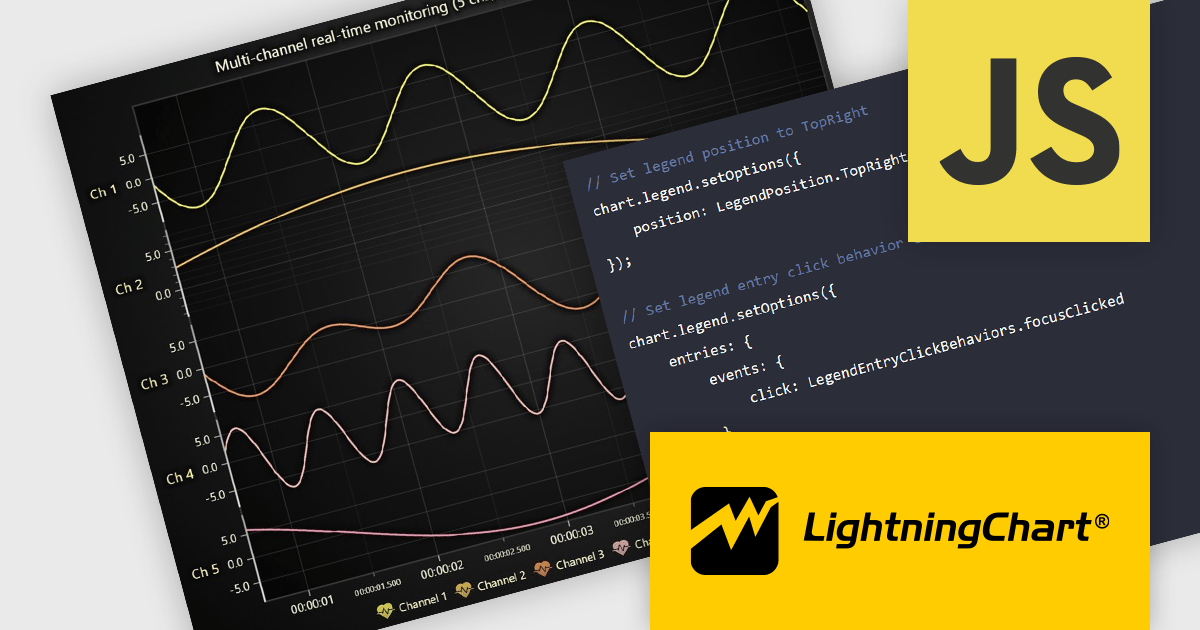
The LightningChart JS v8.0 update completely reworks legend functionality, making legends a property of the chart, removing visual obstructions, and improving adaptability to available space. The API configuration is now more intuitive and capable, with built-in options supporting a wider range of use cases. Plug‑in support also enables easy extension or customization of legend behavior. By default, legends now appear automatically beneath trends, reducing developer setup time, while still allowing you to manually create multiple legends when needed. You can position legends using built-in presets or define custom placements, and control click behavior using either the provided handlers or your own. When creating series, you can also exclude specific ones from appearing in legends, giving you fine-grained control over legend content.
To see a full list of what's new in v8.0, see our release notes.
LightningChart JS is licensed per developer and is available as an annual license with 1 year support. See our LightningChart JS licensing page for full details.
For more information, see our LightningChart JS product page.
전화 : 00798 14 800 6332
팩스 : +1 770 250 6199


