


공식 공급 업체
200 이상의 소프트웨어 개발처와 판매 계약을 맺은 공인 디스트리뷰터로서 합법적인 라이선스를 제공합니다.
모든 브랜드 보기.
영어로 계속 읽기:
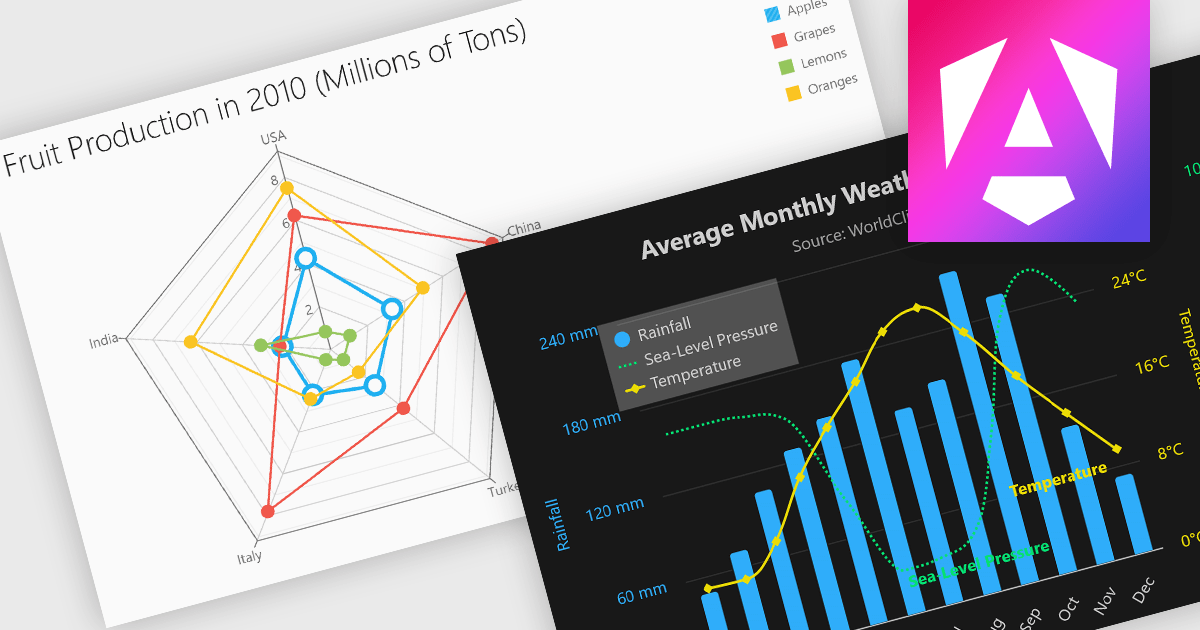
Multi-dimensional and relationship charts allow developers to present complex data structures and inter-variable relationships in a way that’s visually intuitive and analytically powerful. These chart types are essential for exploring correlations, comparing grouped metrics, and visualizing distributions across multiple dimensions. They are commonly used in statistical dashboards, performance analysis tools, and scientific applications where simple line or bar charts aren’t sufficient to capture the full context of the data.
Common charts include:
For an in-depth analysis of features and price, visit our Angular Chart components comparison.
전화 : 00798 14 800 6332
팩스 : +1 770 250 6199


