


공식 공급 업체
200 이상의 소프트웨어 개발처와 판매 계약을 맺은 공인 디스트리뷰터로서 합법적인 라이선스를 제공합니다.
모든 브랜드 보기.
영어로 계속 읽기:
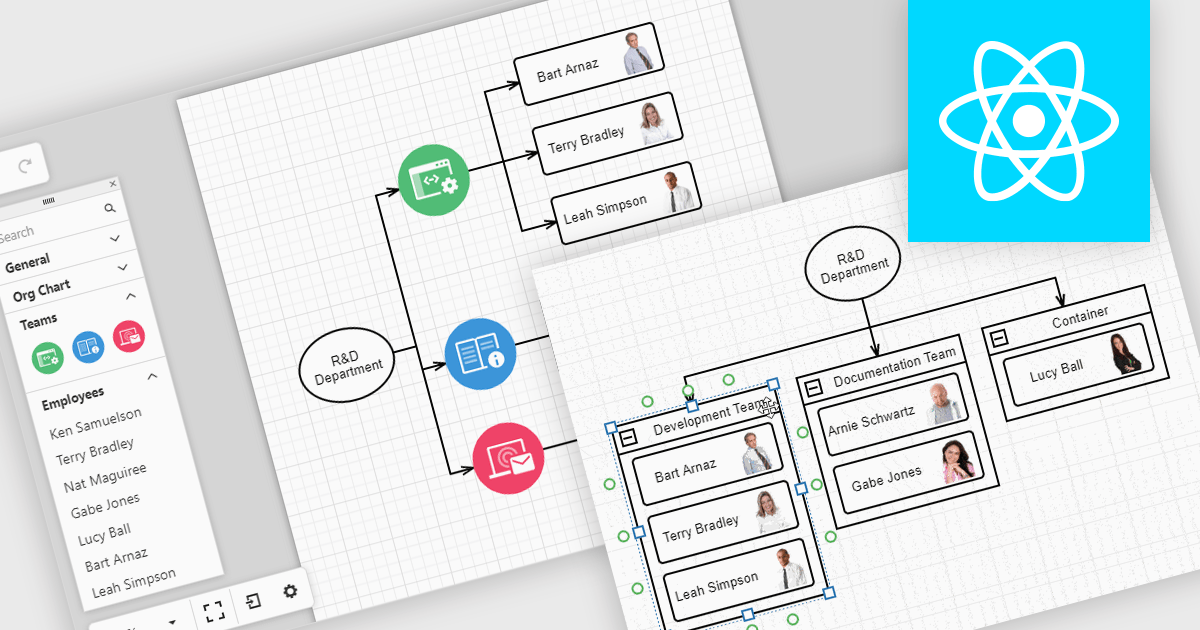
Diagrams in UI toolkits help turn complex data into easy-to-understand visuals that teams can interact with. For example, organizational charts show company structures and reporting lines in a layout that can be updated automatically from HR data. These charts can be expanded, collapsed, or reorganized with drag-and-drop tools, making it easier to understand team relationships and keep information up to date. Diagrams can also be used for workflows, decision trees, and network maps, giving teams a clear, flexible way to present and manage information.
Several React UI suites offer diagram controls including:
For an in-depth analysis of features and price, visit our React UI suite comparison.
전화 : 00798 14 800 6332
팩스 : +1 770 250 6199


