


공식 공급 업체
200 이상의 소프트웨어 개발처와 판매 계약을 맺은 공인 디스트리뷰터로서 합법적인 라이선스를 제공합니다.
모든 브랜드 보기.
영어로 계속 읽기:
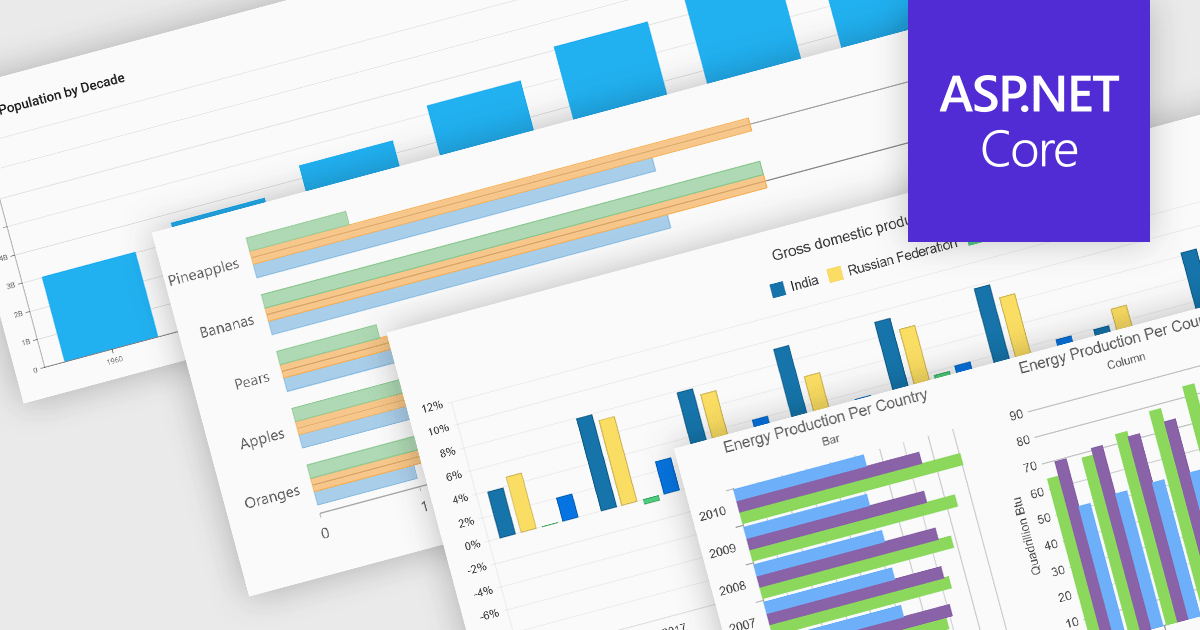
Column and bar charts form fundamental visualization tools in many charting suites. These chart types use vertical (column) or horizontal (bar) bars to represent quantitative data across categories, making them ideal for straightforward comparisons. Typically, you can display single or multiple series, stack values to show cumulative totals, or group categories to highlight differences. Their simplicity and clarity make column and bar charts a staple in dashboards, business reports, and analytics applications where rapid insight is required.
Several ASP.NET Core chart controls offer support for column & bar charts including:
For an in-depth analysis of features and price, visit our ASP.NET Core chart controls comparison.
전화 : 00798 14 800 6332
팩스 : +1 770 250 6199


