


공식 공급 업체
200 이상의 소프트웨어 개발처와 판매 계약을 맺은 공인 디스트리뷰터로서 합법적인 라이선스를 제공합니다.
모든 브랜드 보기.
영어로 계속 읽기:
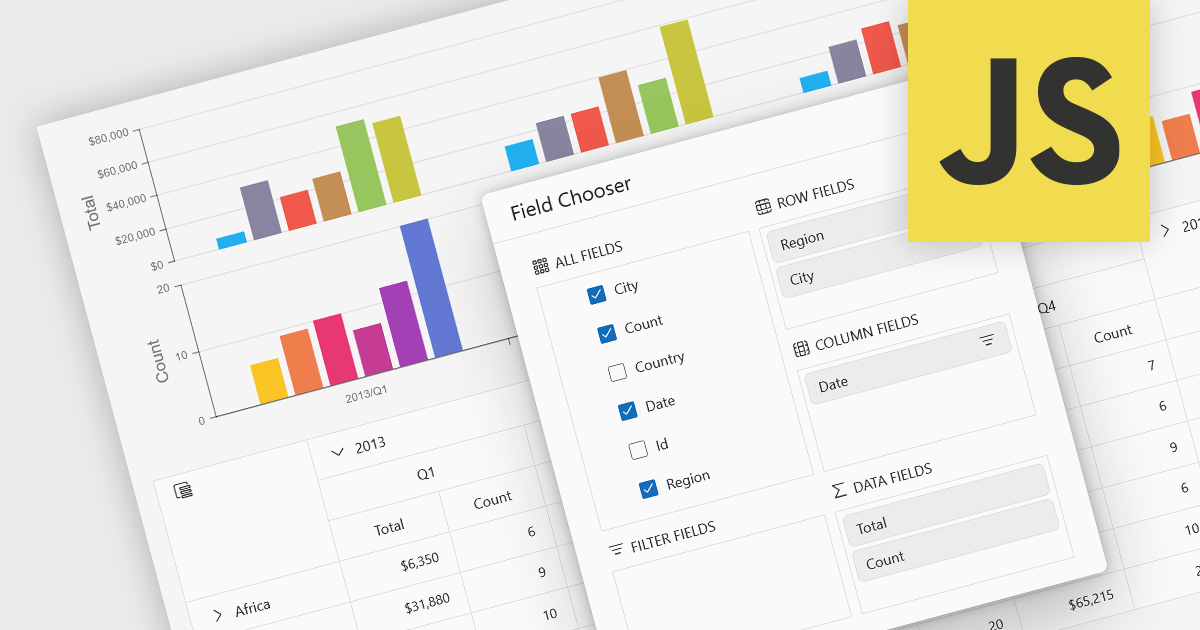
A pivot chart is a dynamic data visualization tool that works in conjunction with a pivot table to present summarized data in a graphical format. It allows users to interactively explore and analyze large datasets by adjusting dimensions such as categories, series, and filters without modifying the underlying data. By visually representing trends, comparisons, and patterns, pivot charts help users make data-driven decisions more efficiently. They are especially useful in business intelligence and reporting scenarios where clarity and flexibility in viewing aggregated data are essential.
Several JavaScript UI suites provide you with pivot chart functionality, including:
For an in-depth analysis of features and price, visit our comparison of UI suites.
전화 : 00798 14 800 6332
팩스 : +1 770 250 6199


