


공식 공급 업체
200 이상의 소프트웨어 개발처와 판매 계약을 맺은 공인 디스트리뷰터로서 합법적인 라이선스를 제공합니다.
모든 브랜드 보기.
영어로 계속 읽기:
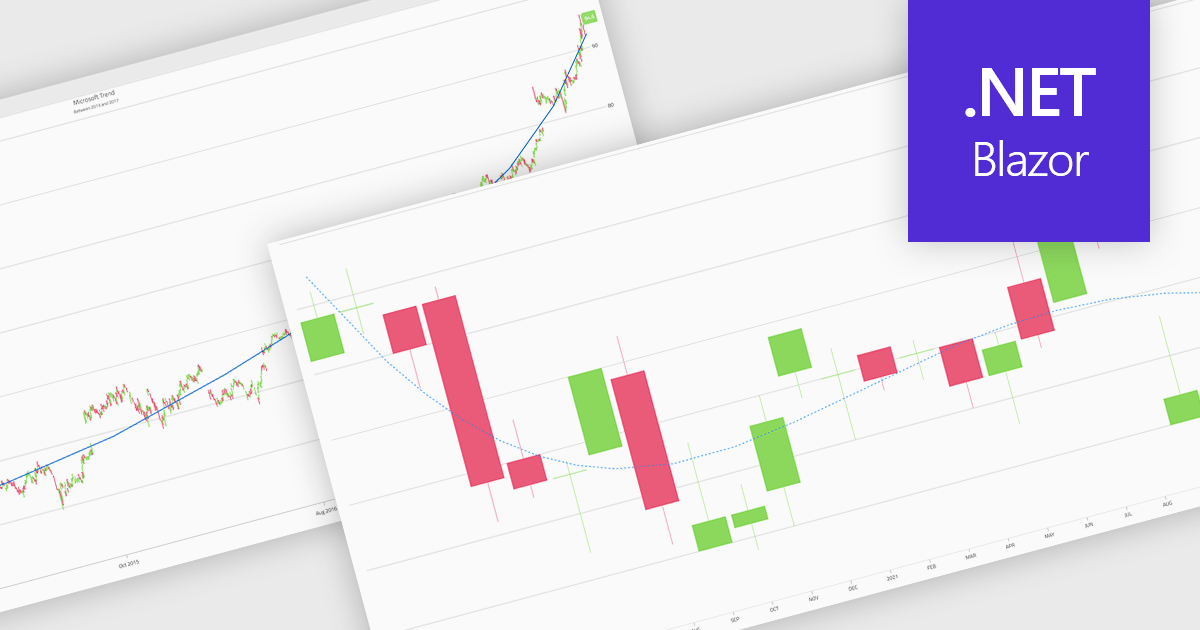
Trend lines in charts are analytical tools that represent the general direction or tendency of data over time, helping users interpret patterns that may not be immediately visible in raw data. By smoothing out short-term fluctuations, trend lines clarify long-term behavior, highlight growth or decline, and support more informed decision-making. They are commonly used in business dashboards to track performance metrics, in financial analysis to assess market trends, and in operational reporting to identify recurring patterns, forecast outcomes, and compare multiple data series with greater clarity.
Several Blazor chart components provide trend line support including:
For an in-depth analysis of features and price, visit our Blazor Chart Component comparison.
전화 : 00798 14 800 6332
팩스 : +1 770 250 6199


