


공식 공급 업체
200 이상의 소프트웨어 개발처와 판매 계약을 맺은 공인 디스트리뷰터로서 합법적인 라이선스를 제공합니다.
모든 브랜드 보기.
영어로 계속 읽기:
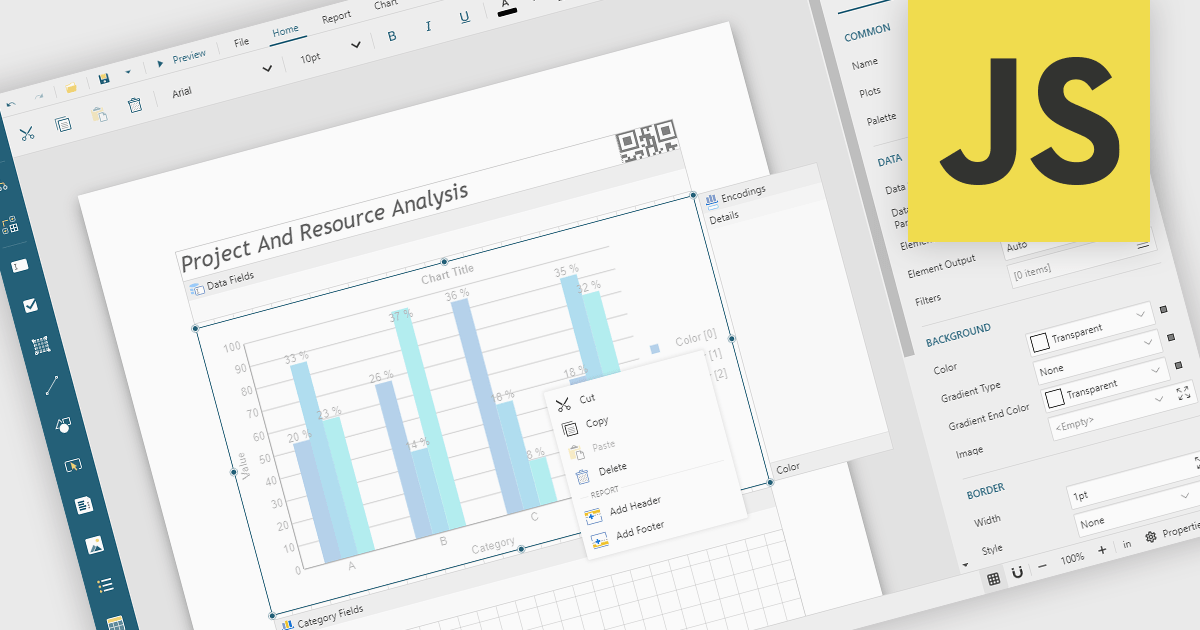
A Visual Report Designer is an application that enables users to create interactive, analytical, and print-ready reports using an intuitive, drag-and-drop interface. It supports fully customizable templates and data visualization components, helping teams present complex information clearly while maintaining consistent branding and layouts. Typical use cases include executive dashboards, financial and operational reports, customer analytics summaries, compliance documents, and branded client-facing reports.
Several JavaScript reporting components offer visual report designers including:
For an in-depth analysis of features and price, visit our JavaScript reporting comparison.
전화 : 00798 14 800 6332
팩스 : +1 770 250 6199


