


공식 공급 업체
200 이상의 소프트웨어 개발처와 판매 계약을 맺은 공인 디스트리뷰터로서 합법적인 라이선스를 제공합니다.
모든 브랜드 보기.
영어로 계속 읽기:
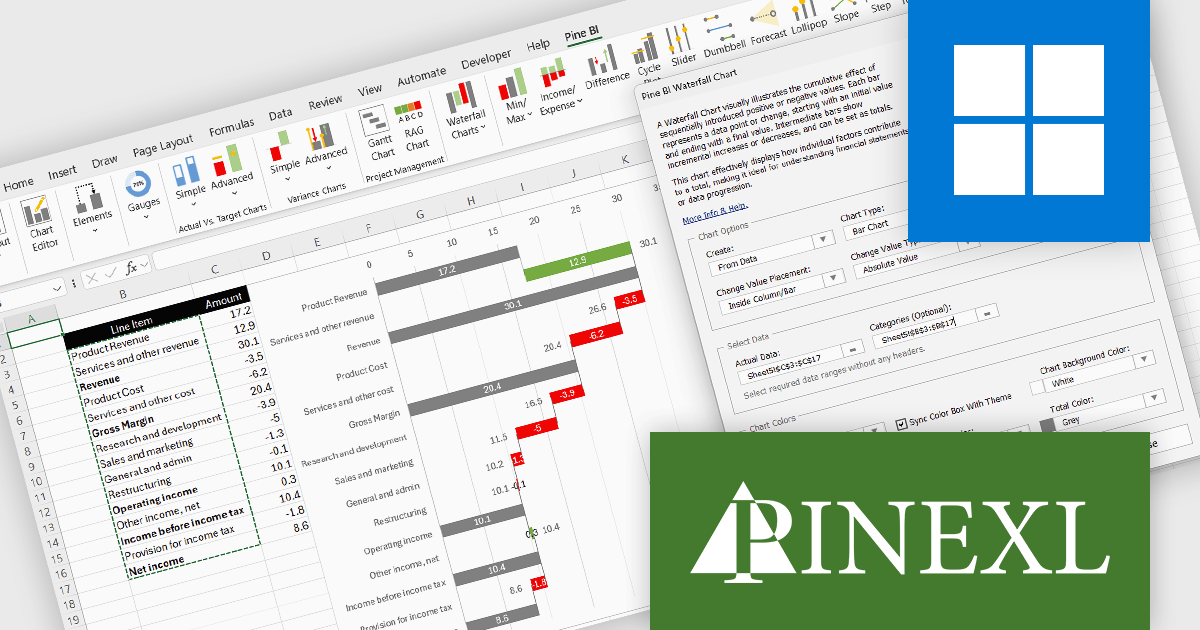
The Pine BI Excel Add-In facilitates the rapid generation of sophisticated and interactive Excel charts, enabling the transformation of standard workbooks into engaging dashboards that improve data visualization. These easily shareable visuals can also be integrated into Microsoft Word and PowerPoint, improving the creation of impactful reports and presentations across various business applications.
The Pine BI Excel Add-In v2.1 update improves waterfall chart functionality by introducing rebuilt formulas that support a cleaner and more consistent data structure. Instead of relying on automatically calculated totals that required blank fields, developers can now explicitly define which values act as totals within the dataset. This approach simplifies data preparation, removes the need for automatic final totals, and makes chart calculations more transparent and predictable. As a result, developers can create and maintain waterfall visualizations more efficiently, particularly when working with complex financial or analytical models.
To see a full list of what's new in v2.1, see our release notes.
Pine BI Excel Add-In is licensed annually on a subscription basis with 1, 5, and 10 seat options, requiring renewal for continued use and covering each concurrent computer, with the ability to transfer individual seat activation's as needed. See our Pine BI Excel Add-In licensing page for full details.
For more information, explore the Pine BI Excel Add-In product range.
전화 : 00798 14 800 6332
팩스 : +1 770 250 6199


