


공식 공급 업체
200 이상의 소프트웨어 개발처와 판매 계약을 맺은 공인 디스트리뷰터로서 합법적인 라이선스를 제공합니다.
모든 브랜드 보기.
영어로 계속 읽기:
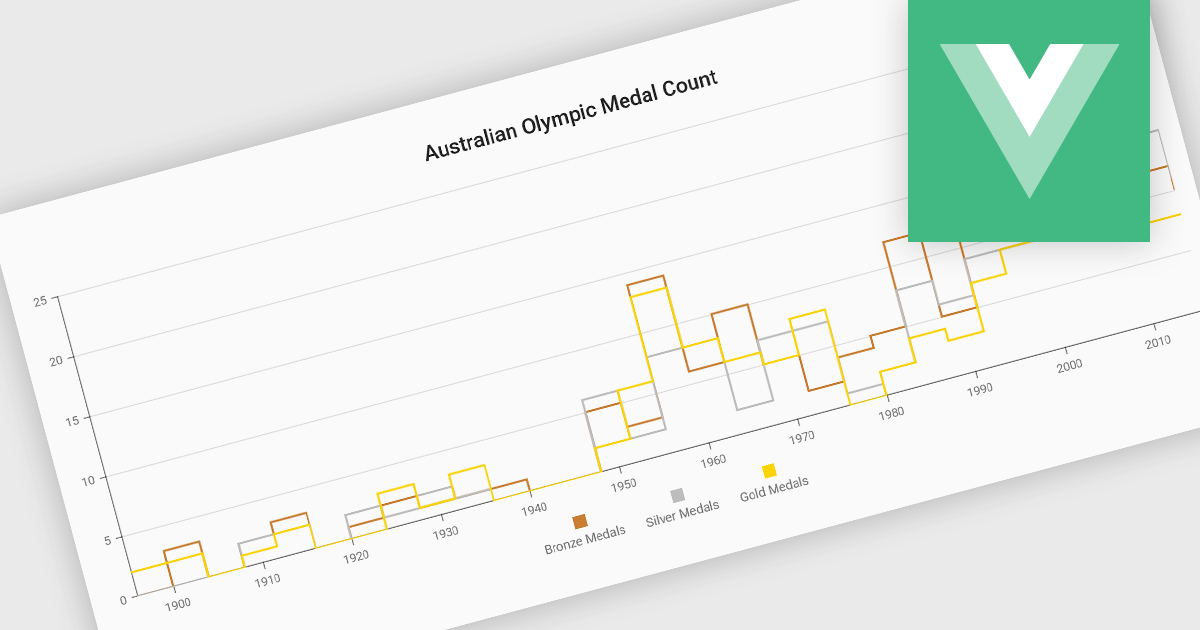
Step line charts are a variation of line charts that display changes between data points as a series of horizontal and vertical segments rather than diagonal lines. This structure highlights discrete transitions between values, making it easier to show when a change occurs and how long a value remains constant before the next update. Step line charts are useful for representing processes where values shift at specific moments, such as pricing tiers, system states, or configuration thresholds. By clearly separating periods of stability from points of change, the chart type helps developers and analysts interpret state-based or event-driven data with greater precision.
Several Vue.js chart components support the step line chart type, including:
For an in-depth analysis of features and price, visit our comparison of Vue.js charting components.
전화 : 00798 14 800 6332
팩스 : +1 770 250 6199


