


공식 공급 업체
200 이상의 소프트웨어 개발처와 판매 계약을 맺은 공인 디스트리뷰터로서 합법적인 라이선스를 제공합니다.
모든 브랜드 보기.
영어로 계속 읽기:
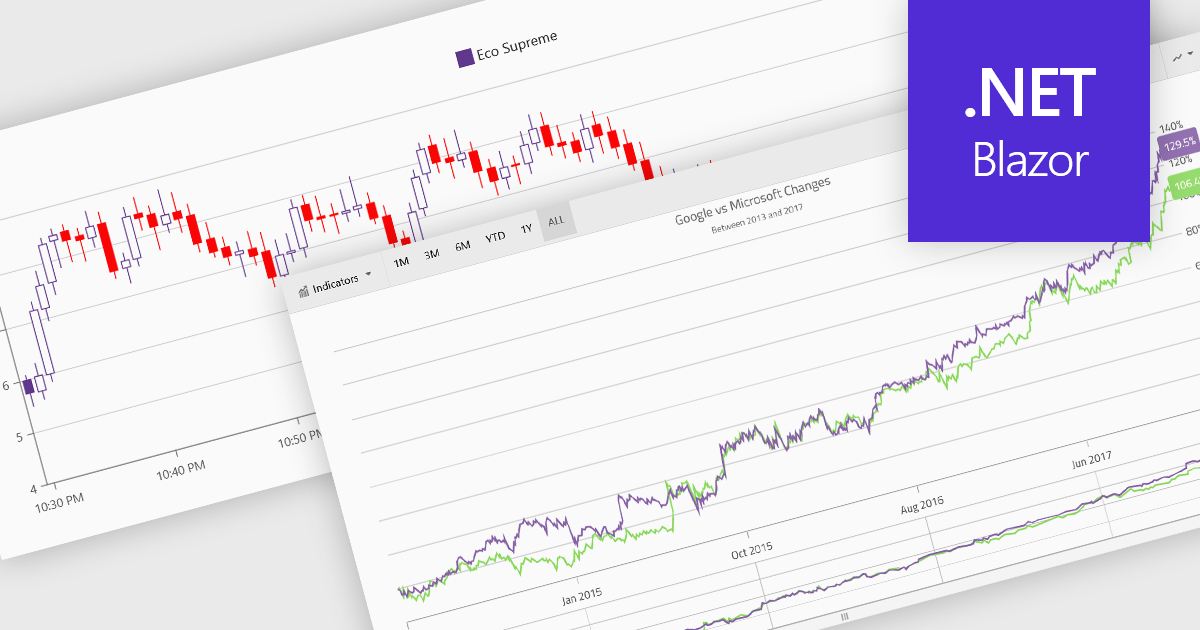
Financial charts are specialized visualizations designed to represent market data and price movements over time. Commonly used in trading platforms and analytical applications, these charts help users interpret open, high, low, and close values, as well as trends and volatility. By providing standardized financial visualizations, charting components enable developers to deliver tools that support technical analysis, decision-making, and real-time data exploration in finance-focused applications.
Common features include:
For an in-depth analysis of features and price, visit our Blazor charts components comparison.
전화 : 00798 14 800 6332
팩스 : +1 770 250 6199


