


공식 공급 업체
200 이상의 소프트웨어 개발처와 판매 계약을 맺은 공인 디스트리뷰터로서 합법적인 라이선스를 제공합니다.
모든 브랜드 보기.
영어로 계속 읽기:
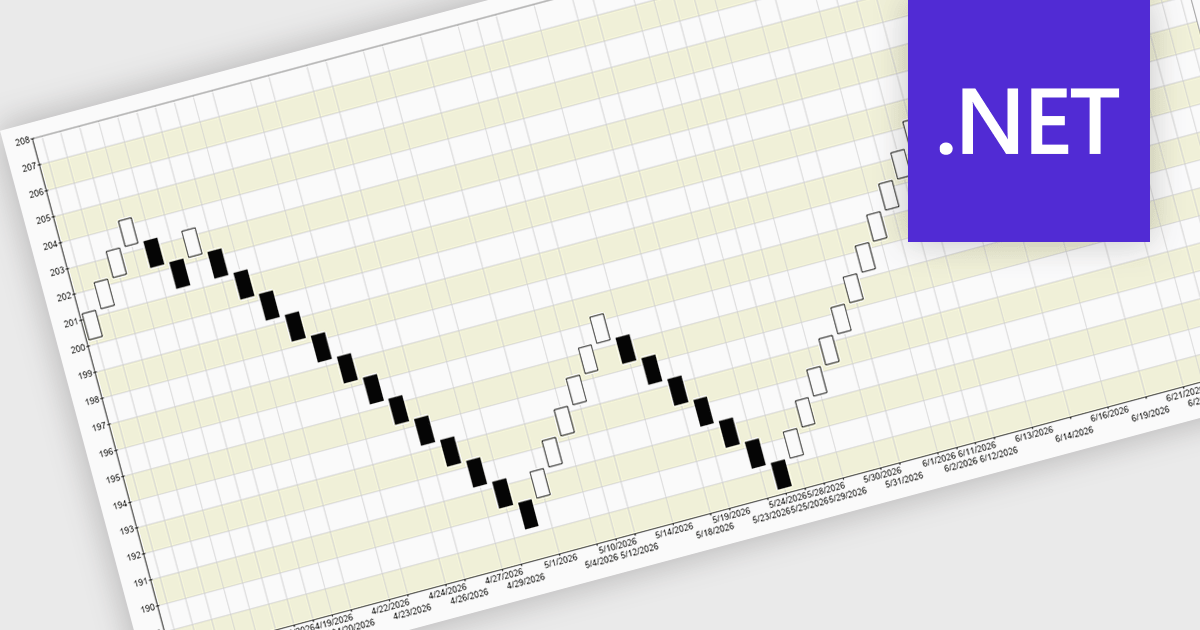
A Renko chart is a type of price chart used in technical analysis that focuses exclusively on price movement rather than time, displaying data as a series of uniform “bricks” that form only when the market moves by a predefined amount. This structure helps filter out minor price fluctuations, making trends and reversals easier to identify while reducing visual noise and improving clarity. As a result, traders can make more informed decisions, confirm trends with greater confidence, and simplify their analysis. Renko charts are commonly used in trend-following strategies, breakout trading, and support and resistance analysis, where a clear view of sustained price direction is more valuable than tracking every small market movement.
Several .NET Chart controls offer a Renko chart including:
For an in-depth analysis of features and price, visit our comparison of .NET Chart controls.
전화 : 00798 14 800 6332
팩스 : +1 770 250 6199


