


공식 공급 업체
200 이상의 소프트웨어 개발처와 판매 계약을 맺은 공인 디스트리뷰터로서 합법적인 라이선스를 제공합니다.
모든 브랜드 보기.
영어로 계속 읽기:
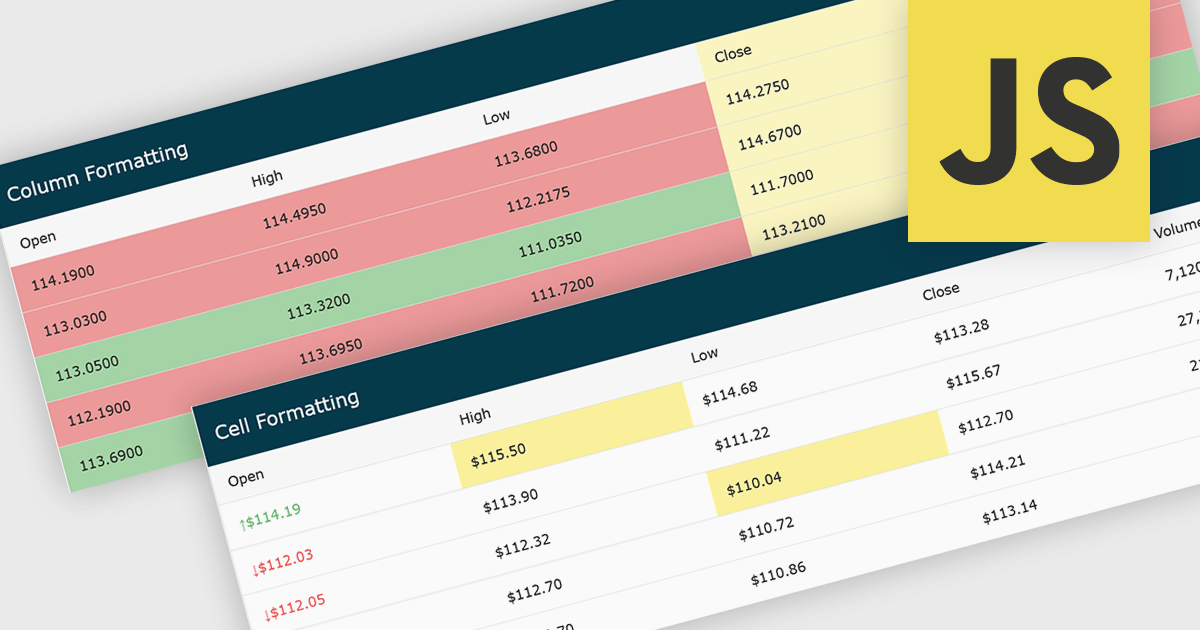
Conditional formatting in grids automatically applies visual styles such as colors or icons based on defined rules, making it easier to interpret large datasets at a glance. It improves readability, highlights patterns and outliers, and supports faster, more informed decision making by surfacing key insights in real time. Common use cases include flagging budget issues in financial reports, emphasizing top performing sales data, monitoring KPIs, and drawing attention to errors or critical statuses in operational tools.
Several JavaScript grid controls offer conditional formatting, including:
For an in-depth analysis of features and price, visit our comparison of JavaScript Grid controls.
전화 : 00798 14 800 6332
팩스 : +1 770 250 6199


