


공식 공급 업체
200 이상의 소프트웨어 개발처와 판매 계약을 맺은 공인 디스트리뷰터로서 합법적인 라이선스를 제공합니다.
모든 브랜드 보기.
영어로 계속 읽기:
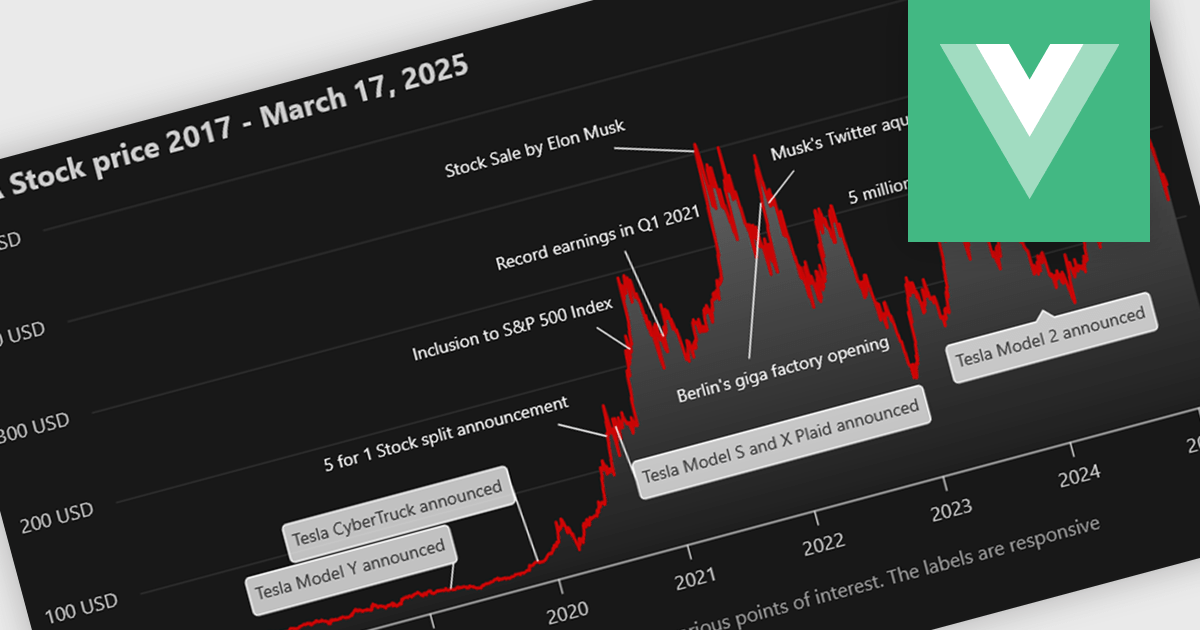
Annotation support in a Vue.js chart component refers to the capability to overlay additional contextual elements, such as labels, markers, lines, or regions, directly onto a chart to highlight specific data points, thresholds, or events. This feature enables developers to enrich visualizations with meaningful insights without altering the underlying dataset, making it easier to communicate key information such as trends, anomalies, or business rules within the UI.
Several Vue.js chart components support chart annotations, including:
For an in-depth analysis of features and price, visit our comparison of Vue.js charting components.
전화 : 00798 14 800 6332
팩스 : +1 770 250 6199


