


공식 공급 업체
200 이상의 소프트웨어 개발처와 판매 계약을 맺은 공인 디스트리뷰터로서 합법적인 라이선스를 제공합니다.
모든 브랜드 보기.

ONLYOFFICE Docs is a comprehensive online editor, allowing users to create text documents, spreadsheets, presentations, and forms. It enables your users to edit, share, and collaborate on documents online in their preferred browser, within your own application. It is fully compatible with OOXML (Office Open XML) formats and supports popular Microsoft Office and other document formats such as CSV, DOC, DOCX, EPUB, HTML, ODP, ODS, ODT, PDF, PPT, PPTX, RTF, TXT, XLS, and XLSX.
The ONLYOFFICE Docs v9.1 update enhances the PDF Editor to provide a more efficient and secure document management experience for developers and teams. It introduces advanced redaction tools that allow precise removal of sensitive information, including the ability to find and redact specific terms or entire pages. The update also expands annotation capabilities with customizable shapes and drawing tools for clearer document markup. Additionally, developers can now embed charts and SmartArt graphics directly within PDFs, enabling better visualization of data and smoother integration of visual elements without leaving the editing environment.
To see a full list of what's new in v9.1.0, see our release notes.
ONLYOFFICE Docs Developer Edition is licensed by the number of simultaneous document connections and is available as an annual license with 1 year support and upgrades. See our ONLYOFFICE Docs Developer Edition licensing page for full details.
For more information, see our ONLYOFFICE Docs Developer Edition product page.
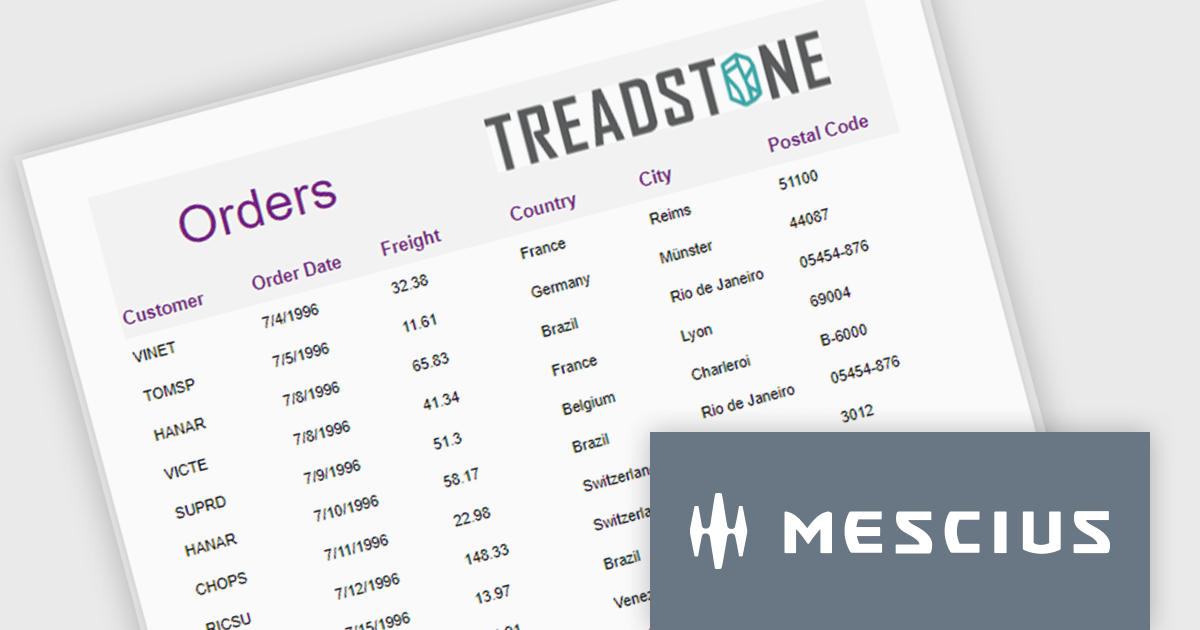
ActiveReportsJS is a robust JavaScript reporting tool that enables developers and report authors to seamlessly design and integrate interactive reports into web applications. It offers advanced features such as drill-down capabilities, runtime data filtering, and interactive parameters, enhancing the functionality and usability of reports. With compatibility across popular frameworks and the flexibility of its report designer component, ActiveReportsJS simplifies the visualization of diverse data sets, making it ideal for applications that require financial reporting, such as balance sheets, and other dynamic reporting needs.
In this blog post, MESCIUS Product Manager Joel Parks highlights real-world scenarios in where you can use ActiveReportsJS to provide users with the capability to define data sources on the fly, using Runtime Data Binding to dynamically inject data into your Angular Reporting component at runtime. Steps include:
This powerful capability gives your application the flexibility to generate customized reports based on user input, server logic, or changing data sources, without forcing the report designer to predefine every field.
Read the full blog to get started building powerful, dynamic reports.
ActiveReportsJS is licensed on an annual subscription or perpetual basis and is available as a Single Deployment License for non-commercial use, and as a Single Domain License or Unlimited Domain License for commercial and/or SaaS use. See our ActiveReportsJS licensing page for full details.
For more information, visit our ActiveReportsJS product page.
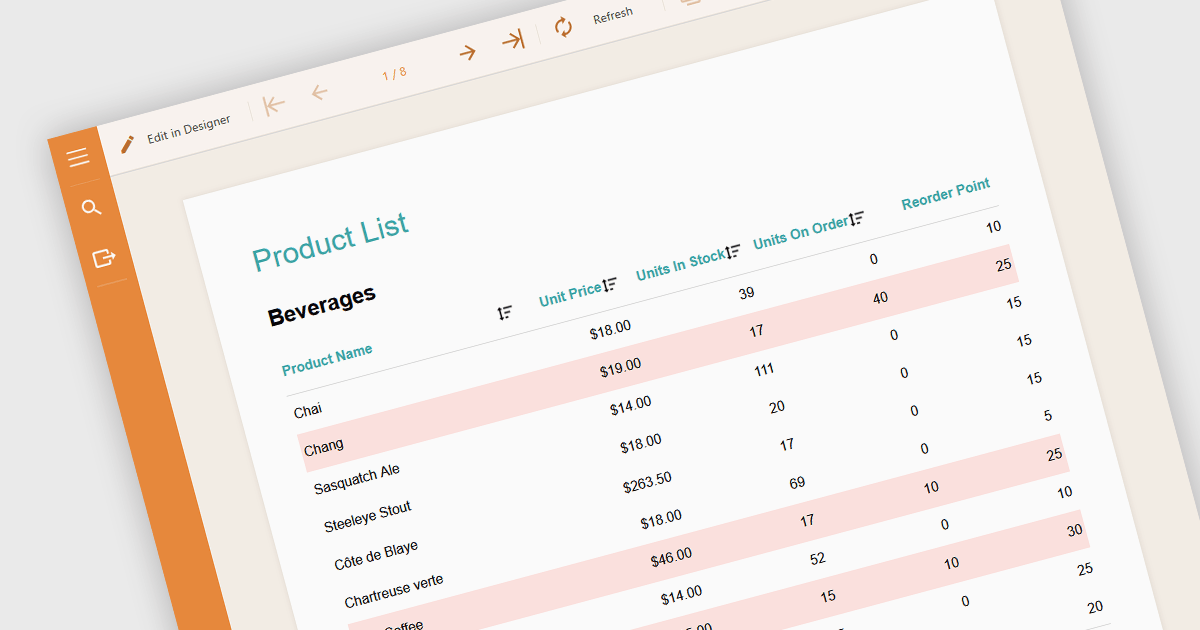
Conditional formatting in a report is a feature that automatically applies visual styles, such as font or background color, to the content within the report based on logical conditions or the data values themselves. This technique allows users to highlight trends, anomalies, or key thresholds by dynamically adjusting the appearance of report elements according to predefined rules, which is especially useful in performance monitoring or exception tracking scenarios. It improves the readability of data-heavy reports by making important information stand out, helping users quickly identify patterns, exceptions, or performance issues. For developers and analysts, it provides a practical way to make complex datasets easier to interpret without manual intervention.
Several Angular reporting components allow you to apply conditional formatting, including:
For an in-depth analysis of features and price, visit our comparison of Angular reporting components.
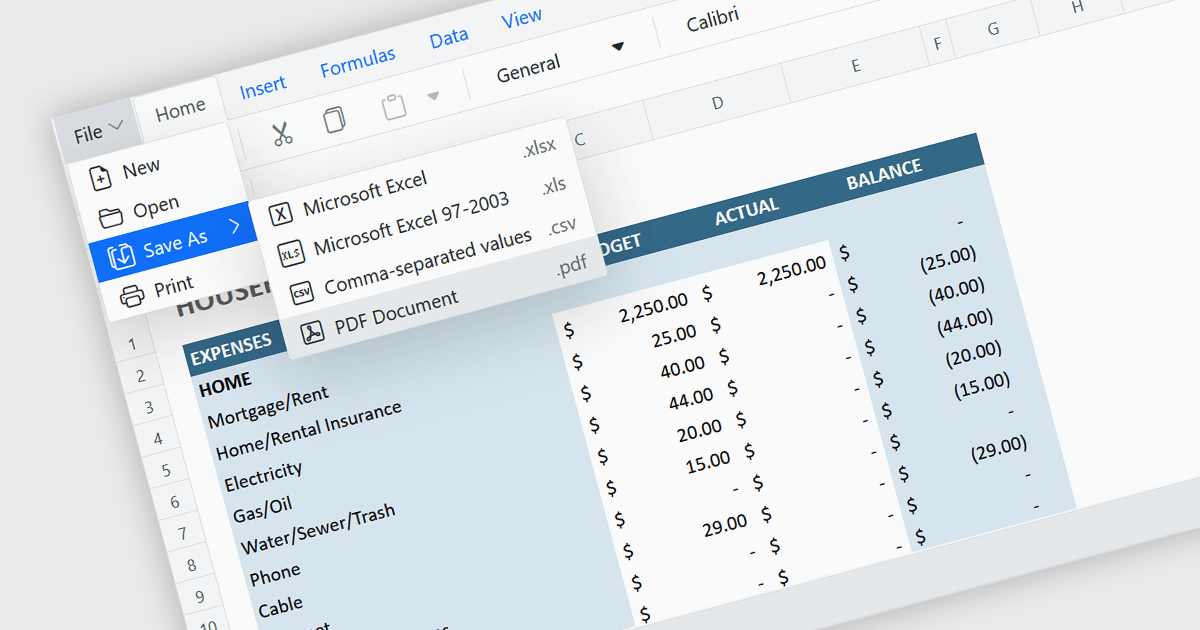
Exporting a spreadsheet to PDF is a widely used feature that allows users to generate fixed-layout, print-ready versions of their spreadsheet data, converting the contents of the spreadsheet file, into a Portable Document Format (PDF) file. This capability ensures that formatting, styling, and content of the original spreadsheet, including tables, charts, and cell styles, are preserved exactly as intended, regardless of the device or application used to open the file. It is especially useful for sharing finalized documents, such as reports or financial summaries, with stakeholders who do not need to interact with the data directly.
Several Angular spreadsheet components allow you to export to PDF, including:
For an in-depth analysis of features and price, visit our comparison of Angular spreadsheet components.

Selecting and copying text is a core feature of PDF viewer components, allowing users to highlight, extract, and paste content from documents without needing an external PDF editor. This capability is essential in workflows where text needs to be reused, such as quoting, data extraction, or forwarding snippets. A well-implemented text selection feature supports precise region selection, preserves text formatting and order (even across lines or columns), and integrates with the system clipboard reliably.
Several Angular PDF viewer controls offer the ability to select and copy text from PDF files, including:
For an in-depth analysis of features and price, visit our Angular PDF viewer controls comparison.
전화 : 00798 14 800 6332
팩스 : +1 770 250 6199


