


공식 공급 업체
200 이상의 소프트웨어 개발처와 판매 계약을 맺은 공인 디스트리뷰터로서 합법적인 라이선스를 제공합니다.
모든 브랜드 보기.
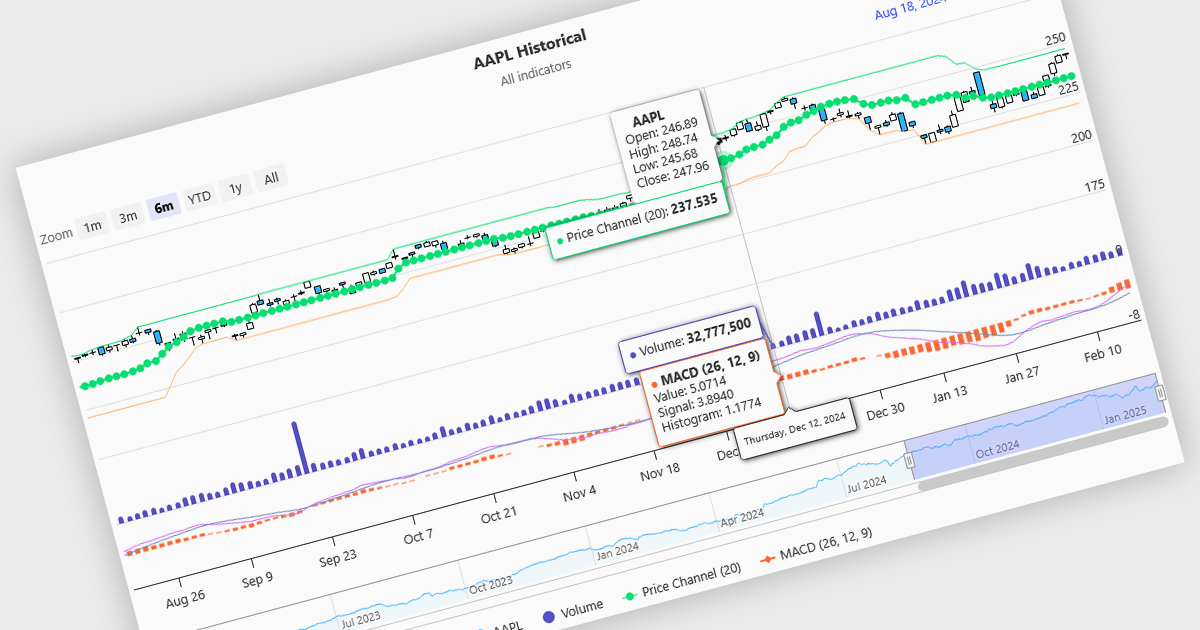
Indicators in a financial chart are mathematical formulas applied to market data, such as price and volume, to generate insights into trends, momentum, volatility, and trade opportunities. Indicators are visualized as lines, histograms, or overlays on the chart, providing dynamic analysis rather than static points. Moving averages track price trends with smooth lines, while oscillators like RSI appear as separate graphs to measure momentum. These tools help traders analyze patterns, confirm price movements, and support decision-making. For software developers, integrating indicators enhances data visualization, enables algorithmic trading strategies, and improves user experience by delivering clear, actionable insights.
Several Angular charting components provide support for indicators within financial charts, including:
For an in-depth analysis of features and price, visit our Angular chart components comparison.
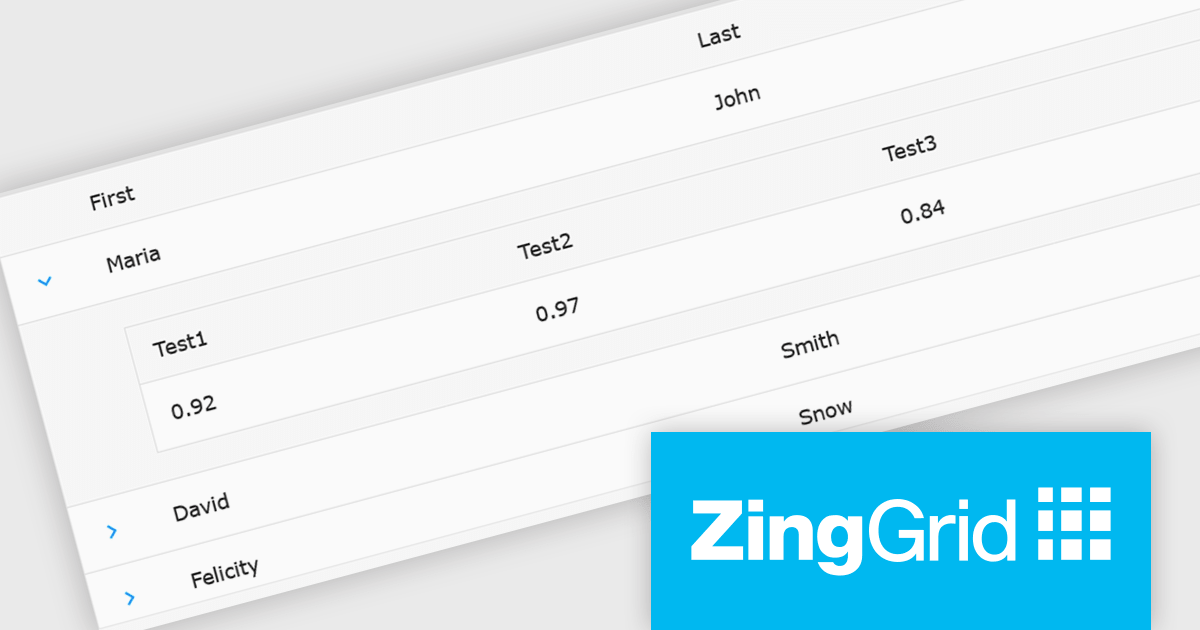
ZingGrid is a JavaScript library that simplifies the creation of interactive data tables and grids within web applications. Utilizing modern web components and focusing on performance and responsiveness, ZingGrid allows developers to implement features like searching, filtering, pagination, and in-line editing with minimal coding. This empowers efficient data visualization and manipulation for users, making it a valuable tool for web development.
The ZingGrid 2.0.0 release adds new Row Details feature that enhances data presentation by allowing users to expand individual rows and reveal supplementary information. This functionality provides a clean and organized way to display additional data without cluttering the main grid view. Whether you are editing, filtering, searching, or sorting your data, the expanded/collapsed state of each row is intelligently preserved, even across pages. This allows users to maintain context and easily access detailed information without losing their place or having to re-expand rows after interacting with other grid functionalities.
To see a full list of what's new in version 2.0.0, see our release notes.
ZingGrid is available as either a Single-Domain Website or Multi-Domain SaaS license. See our ZingGrid licensing page for full details.
For more information, visit our ZingGrid product page.
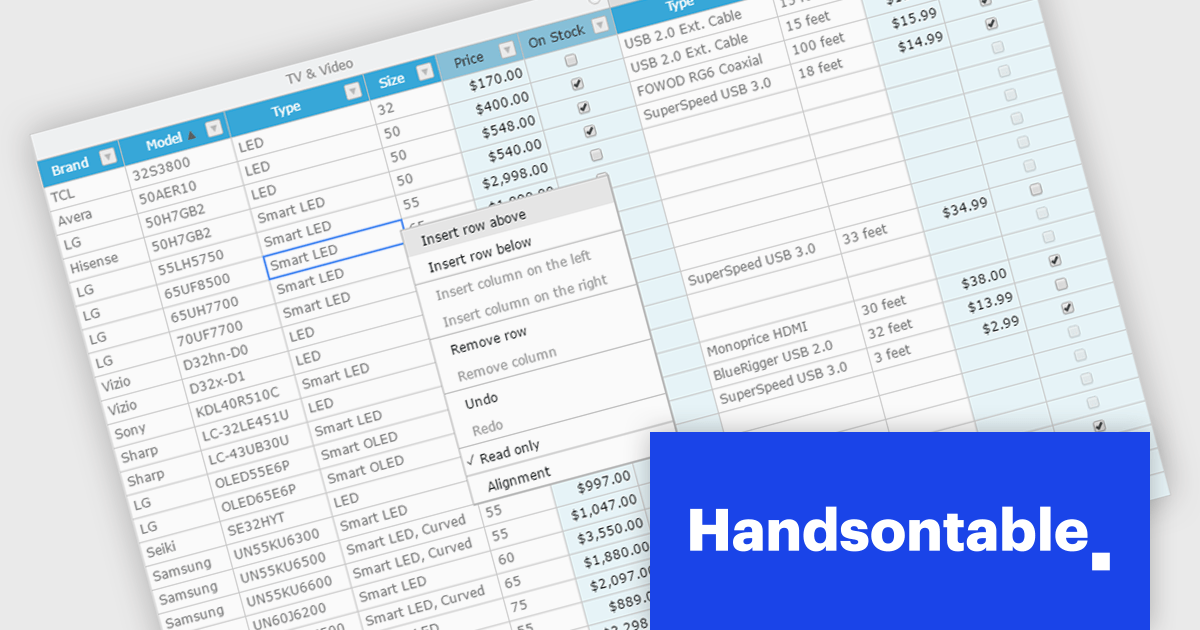
Handsontable is a JavaScript library designed to help developers build interactive data grids into their web applications. Offering a familiar spreadsheet-like interface, it allows users to edit, sort, and filter data with ease. Highly customizable and compatible with popular frameworks like React and Angular, Handsontable empowers developers to build robust data manipulation features into their web applications.
The Handsontable 15.1.0 update enhances table rendering efficiency by reusing and caching cell nodes instead of creating them from scratch during each rendering cycle. This reduces unnecessary DOM manipulations, leading to faster updates, improved responsiveness, and smoother interactions, particularly when handling large datasets. By optimizing how cells are managed, this update minimizes performance bottlenecks, allowing applications to render complex tables more efficiently while maintaining a seamless user experience.
To see a full list of what's new in version 15.1.0, see our release notes.
Handsontable is licensed per developer and is available as an Annual or Perpetual license with 1 year support and maintenance. See our Handsontable licensing page for full details.
For more information, visit our Handsontable product page.
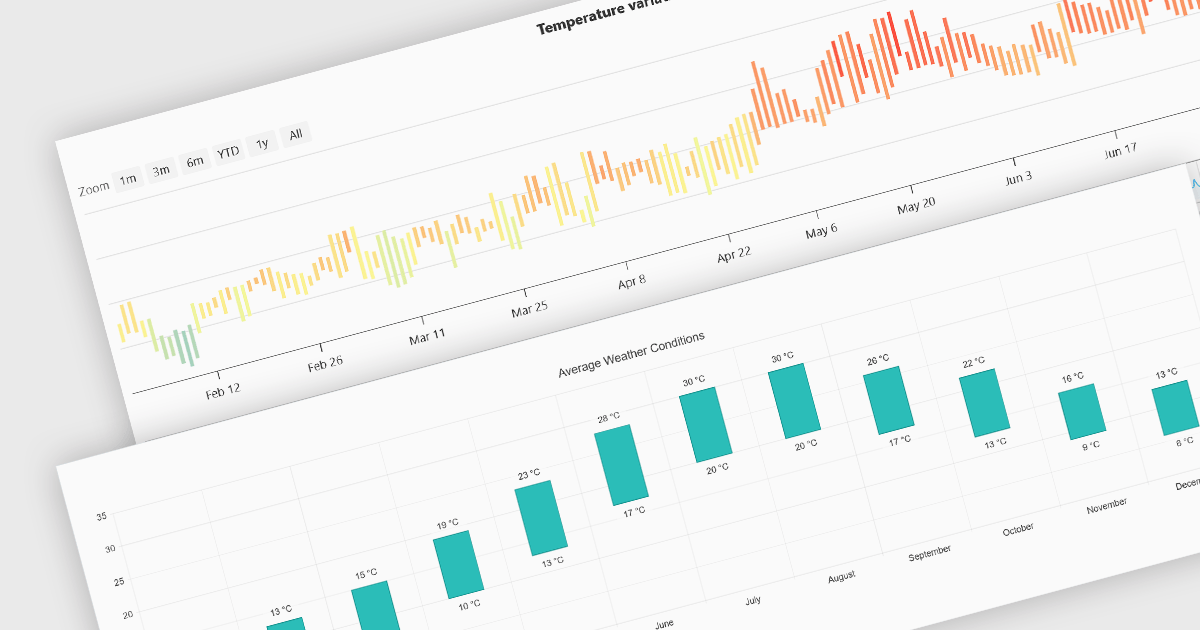
Range bar charts provide a way to visualize data that includes both minimum and maximum values. The bars displayed represent a value range, spanning between the minimum and maximum levels, rather than a single point. This type of chart makes it easier for users to compare variations across different categories or time periods, detect anomalies, and identify trends. This makes them particularly useful for scenarios where understanding variations within a range is important, such as stock price fluctuations, project timelines, or performance metrics. Their structured layout improves readability, making them a valuable tool in financial analysis, scheduling, and business intelligence applications.
Several Angular charting components provide you with range bar charts, including:
For an in-depth analysis of features and price, visit our Angular chart controls comparison.
Kendo UI by Telerik is a comprehensive suite of JavaScript UI components designed to accelerate web application development. Offering pre-built, customizable elements for grids, charts, schedulers, and more, it streamlines UI creation across popular frameworks like jQuery, Angular, React, and Vue. Key features include responsive design, accessibility, and high performance, enhancing user experience. Developers benefit from reduced development time, consistent UI patterns, and the ability to build feature-rich applications faster.
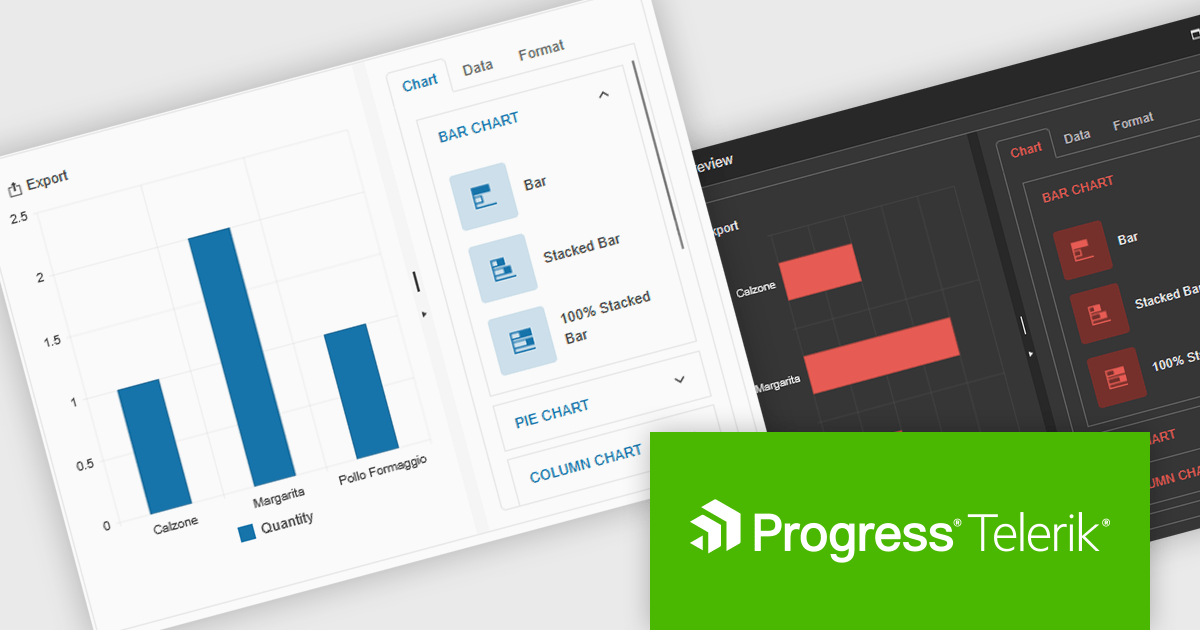
The Kendo UI for jQuery v2025 Q1 update introduces the Chart Wizard, a streamlined tool that simplifies chart creation by allowing developers to generate data-driven visualizations directly from grids, data-bound components, or external sources. This feature reduces manual configuration, enhances workflow efficiency, and ensures a seamless integration process, enabling developers to quickly transform raw data into meaningful insights while maintaining full customization control.
To see a full list of what’s new in v17.1.0 (2025 Q1), see our release notes.
Kendo UI is licensed per developer and has two licensing models: an annual Subscription License and a Perpetual License. The Subscription license provides access to the latest product updates, technical support, and exclusive benefits for a flat annual fee, and must be renewed to continue using the software. The Perpetual license is a one-time purchase granting access to the current released version and includes a one-year subscription for product updates and technical support. After this initial period, users can choose to renew the subscription element to continue receiving updates and support; otherwise, they may continue using the installed version available during their active subscription term but will forgo future updates and support. See our Kendo UI licensing page for full details.
Kendo UI is also available to buy individually or as part of:
전화 : 00798 14 800 6332
팩스 : +1 770 250 6199


