


공식 공급 업체
200 이상의 소프트웨어 개발처와 판매 계약을 맺은 공인 디스트리뷰터로서 합법적인 라이선스를 제공합니다.
모든 브랜드 보기.
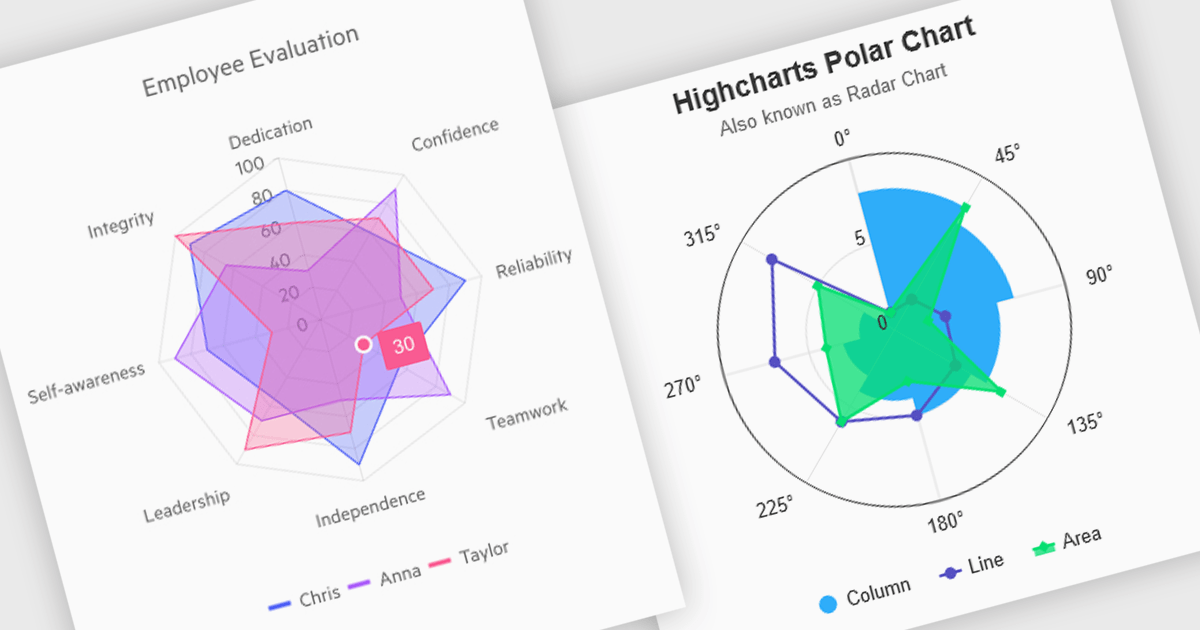
Polar and radar charts provide an intuitive way to visualize multidimensional and circular data. These chart types plot data points relative to a central axis, with polar charts ideal for showcasing proportional relationships, such as seasonal trends or directional metrics, and radar charts excelling at comparing multiple variables, such as performance metrics or skill assessments. Angular’s interactivity enhances engagement with features like tooltips, zooming and real-time updates, making these charts ideal for dashboards and reports. Use cases include analyzing skill assessments, market segmentation, and cyclic trends, delivering clear, actionable insights in a visually compelling format.
Several Angular chart controls offer visual polar and radar chart support including:
For an in-depth analysis of features and price, visit our Angular chart controls comparison:
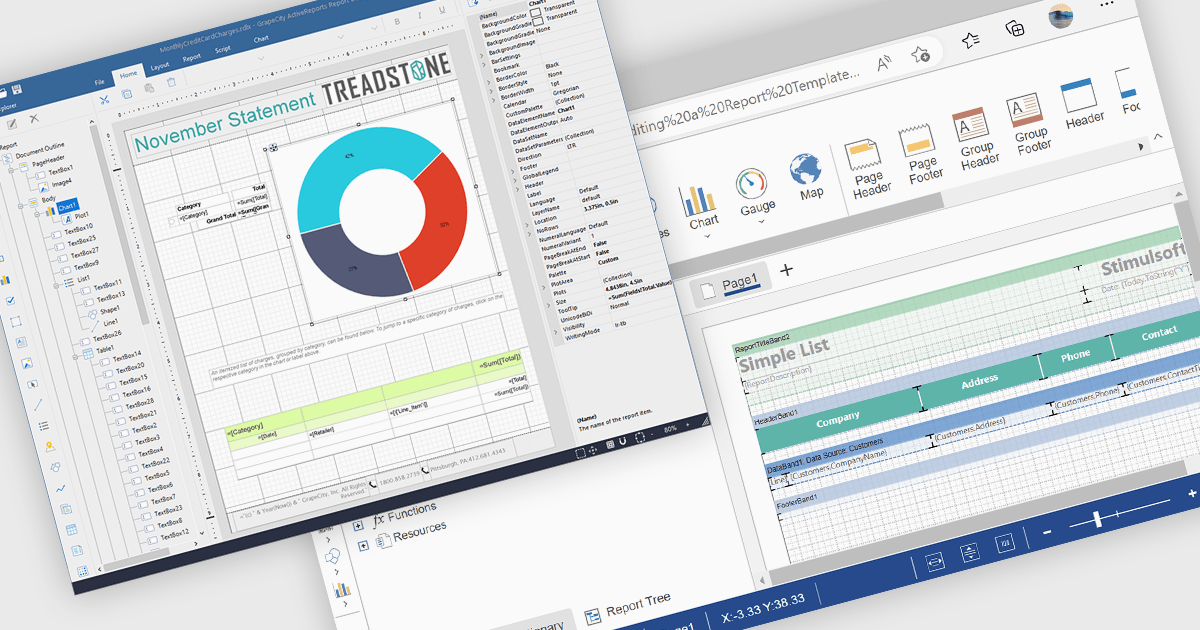
A Visual Report Designer in a reporting control enables users to create and customize data-rich reports through an intuitive, drag-and-drop interface. With ready-to-use templates, interactive elements, and direct data binding, it simplifies report creation while maintaining professional quality. Key benefits include real-time data updates, brand customization, and interactive filters, making it ideal for business intelligence tasks like financial dashboards, performance reports, and analytics summaries. This feature empowers teams to generate insights quickly and make data-driven decisions with ease.
Several Angular reporting controls offer visual report designer support including:
For an in-depth analysis of features and price, visit our Angular Reporting Controls comparison.

Charts in a dashboard component transform raw data into clear, actionable visuals, making it easy to monitor trends, track performance, and spot critical insights in real time. These interactive tools support various use cases, from sales forecasting and KPI tracking to project progress monitoring and customer behavior analysis. By offering a centralized, intuitive view of essential metrics, charts help teams make faster, data-driven decisions, optimize operational efficiency, and respond proactively to emerging opportunities or issues.
Several JavaScript products offer chart components with dashboard support including:
Explore our range of JavaScript dashboard components.
Need help to find the right software license, upgrade or renewal? Call, Email, or Live Chat with our experts.

ONLYOFFICE Docs is a comprehensive online editor, allowing users to create text documents, spreadsheets, presentations, and forms. It enables your users to edit, share, and collaborate on documents online in their preferred browser, within your own application. It is fully compatible with OOXML (Office Open XML) formats and supports popular Microsoft Office and other document formats such as CSV, DOC, DOCX, EPUB, HTML, ODP, ODS, ODT, PDF, PPT, PPTX, RTF, TXT, XLS, and XLSX.
The ONLYOFFICE Docs v8.2 update adds support for performing iterative calculations. This enables formulas to be repeatedly recalculated until a specific, stable result is reached or a set number of attempts is made. By setting iteration limits and defining acceptable precision levels, iterative calculations enable users to control the number of recalculations, allowing the formula to reach an approximation or convergence point that serves as the final value. This process is particularly useful when dealing with circular references, where a formula refers to its own cell either directly or through a sequence of references involving other cells. Without iterative calculations, such formulas would produce errors, as they would require an infinite loop of recalculations. This is widely used in scenarios requiring complex dependencies, such as financial projections, engineering simulations, and scientific modeling.
To see a full list of what's new in v8.2.0, see our release notes.
ONLYOFFICE Docs is licensed by the number of simultaneous document connections and is available as an annual license with 1 year support and upgrades. See our ONLYOFFICE Docs licensing page for full details.
For more information, see our ONLYOFFICE Docs product page.
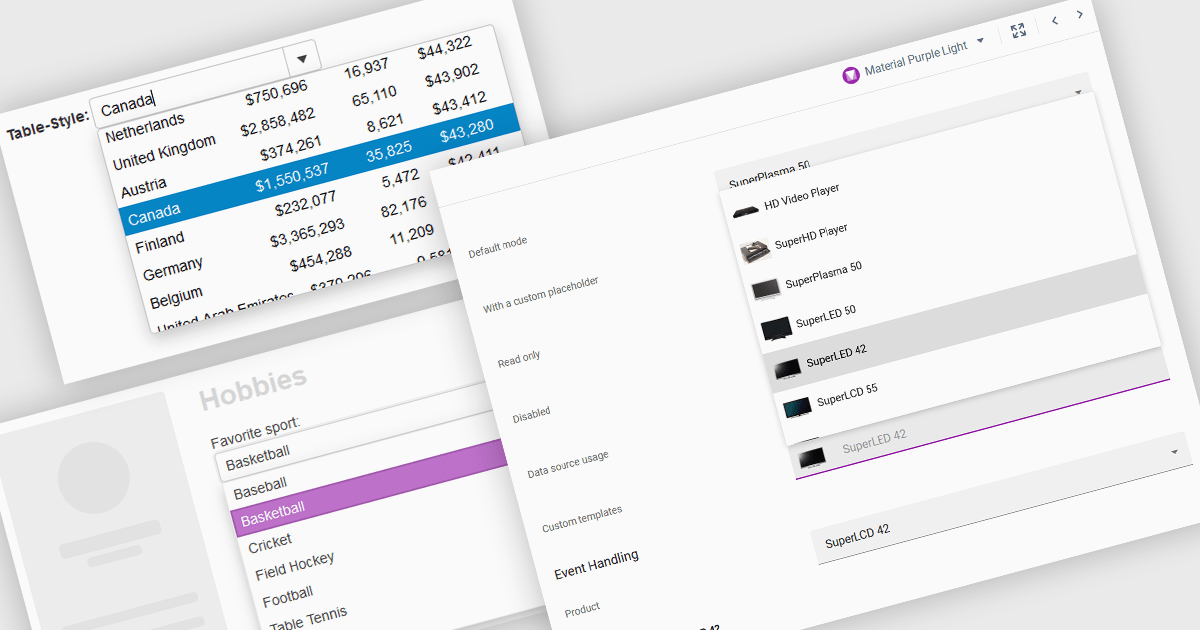
ComboBoxes for Angular are versatile form controls that allow users to select from a predefined list of options or input custom values directly. They provide a flexible and efficient way to handle data entry by combining the ease of selection with the ability to manually input text. For developers, ComboBoxes streamline the user experience by reducing the need for additional input fields while maintaining a clean interface. They enhance data validation and user efficiency, as they can filter large datasets based on user input and bind seamlessly to Angular models, ensuring smooth integration within dynamic forms and grid-based editors.
For an in-depth analysis of features and price, visit our Angular Data Editors controls comparison.
전화 : 00798 14 800 6332
팩스 : +1 770 250 6199


