


공식 공급 업체
200 이상의 소프트웨어 개발처와 판매 계약을 맺은 공인 디스트리뷰터로서 합법적인 라이선스를 제공합니다.
모든 브랜드 보기.
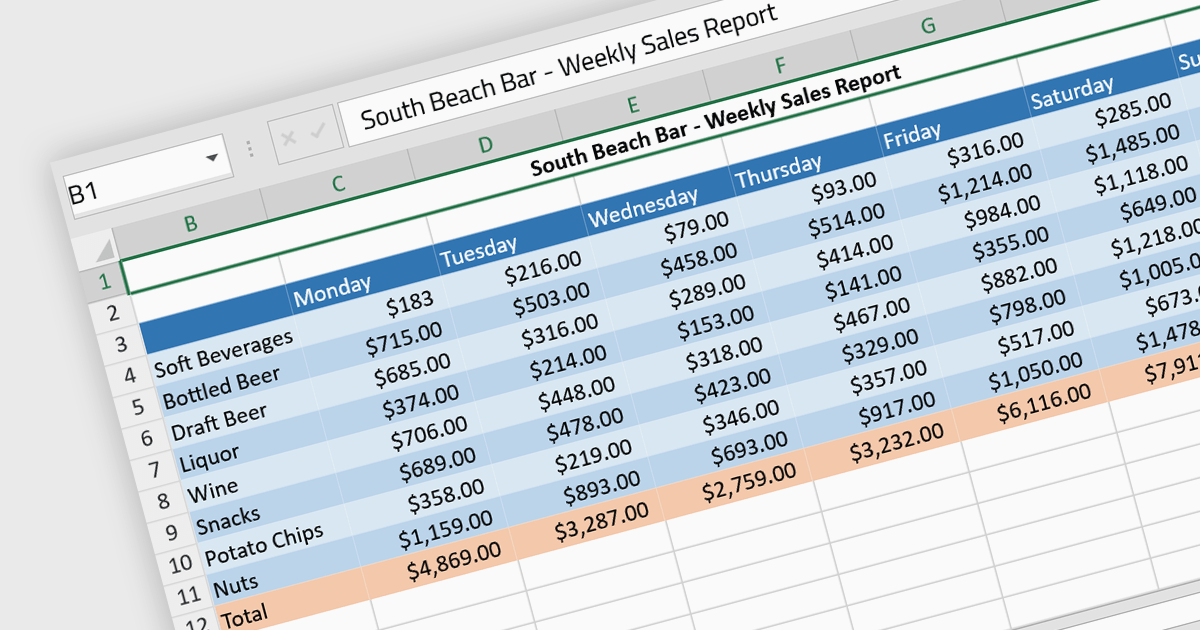
Cell formatting allows you to customize of the appearance and behavior of individual cells within a spreadsheet or data table to improve readability, comprehension, and accuracy of data presentation. This can encompass adjustments to font style, size, and color, as well as the inclusion of borders, shading, numeric or date formatting, cell alignment and so on. By employing cell formatting, users can significantly enhance the readability and organization of their spreadsheets, allowing for quicker data comprehension and clearer communication of the information they contain. It also helps in distinguishing different types of data, emphasizes important figures, and maintains consistency across related documents, thereby reducing the likelihood of errors and misinterpretations.
Several Angular spreadsheet components support cell formatting, including:
For an in-depth analysis of features and price, visit our comparison of Angular spreadsheet controls.
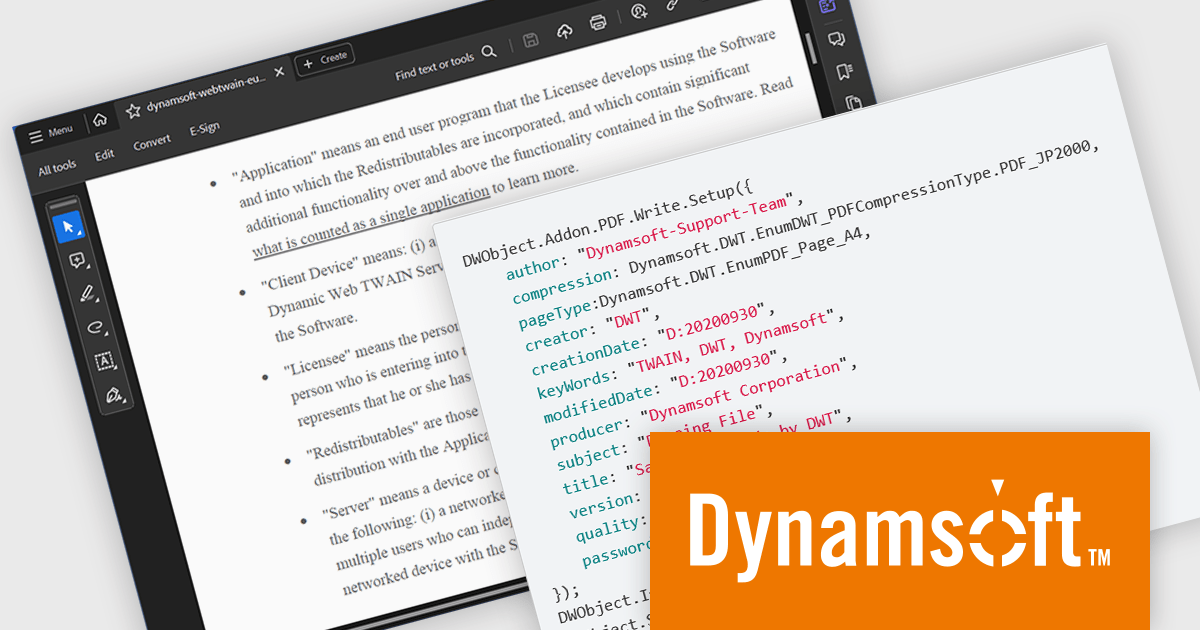
Dynamic Web TWAIN by Dynamsoft is a Software Development Kit (SDK) that simplifies adding document scanning capabilities to your web applications. It offers cross-platform and cross-browser compatibility, allowing users to scan directly from various scanners and webcams using popular browsers like Chrome and Firefox. With just a few lines of JavaScript code, you can integrate powerful scanning features into your web applications, streamlining document management workflows.
The Dynamic Web TWAIN 18.5 release introduces a the ability to generate encrypted PDF files with password protection. This enhancement empowers users to create secure, password-restricted PDFs directly within their applications, eliminating the need for external tools and bolstering data security. This functionality is particularly advantageous for organizations in regulated industries or those handling sensitive information, as it ensures information confidentiality throughout the document lifecycle, from storage and sharing to archiving.
To see a full list of what's new in version 18.5, see our release notes.
Dynamic Web TWAIN is licensed per Client Device and is available as an Annual license. See our Dynamic Web TWAIN licensing page for full details.
For more information, visit our Dynamic Web TWAIN product page.
Progress Telerik is a leading software publisher that provides a range of tools and solutions to help developers build and deploy modern applications. Its product range include UI libraries, reporting tools and testing frameworks. Telerik products are used by millions of developers around the world to build a wide variety of applications.
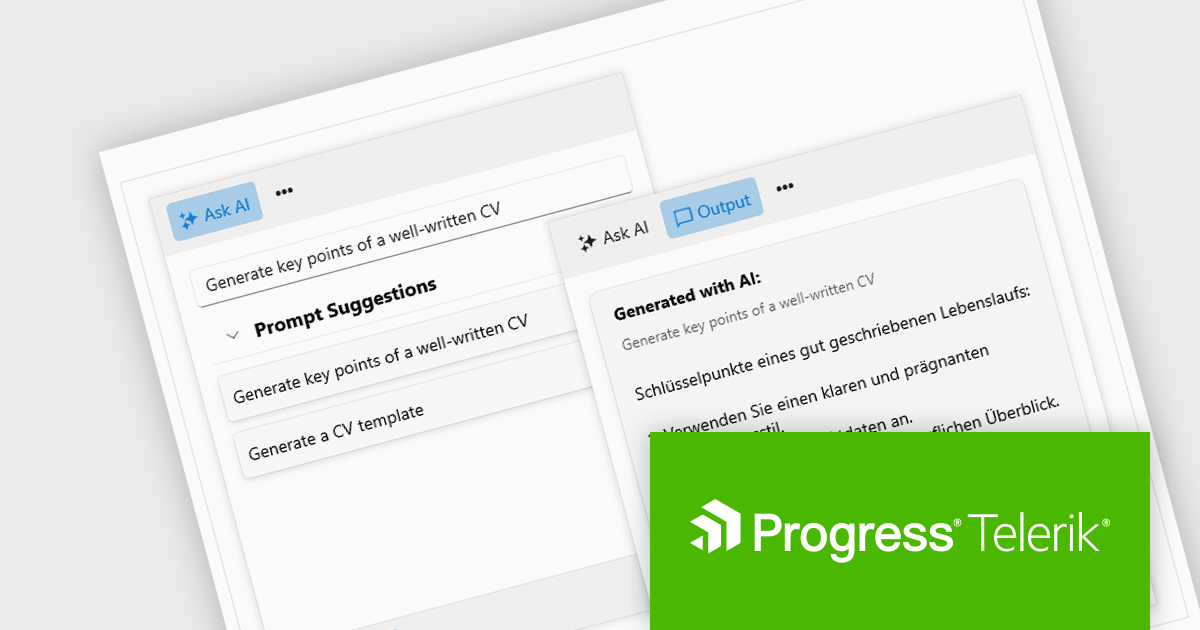
The 2024 Q2 release completes the blending of AI with UI, thereby bridging the gap between an app and next-generation AI language model applications. The new "AIPrompt" component allows you to integrate artificial intelligence prompts into web, mobile and desktop applications, providing users with a modern interface to interact with AI services.
The following Telerik products have been updated with the AI Prompt component:
To see what else is new in 2024 Q2, see our release notes:
Telerik products are licensed per developer and are available as perpetual licenses with a one year support subscription, which is available in three tiers: Lite, Priority or Ultimate. For more information see:
Rich text functionality in Angular UI suites empowers developers to create applications where users can format and style text directly, fostering a more engaging and user-friendly experience for content creation and editing tasks. They offer a user-friendly interfaces for formatting, adding visual elements like images, and structuring content with features like lists and tables.
Several Angular UI suites offer Rich Text functionality, including:
For an in-depth analysis of features and price, visit our Angular UI suites comparison.
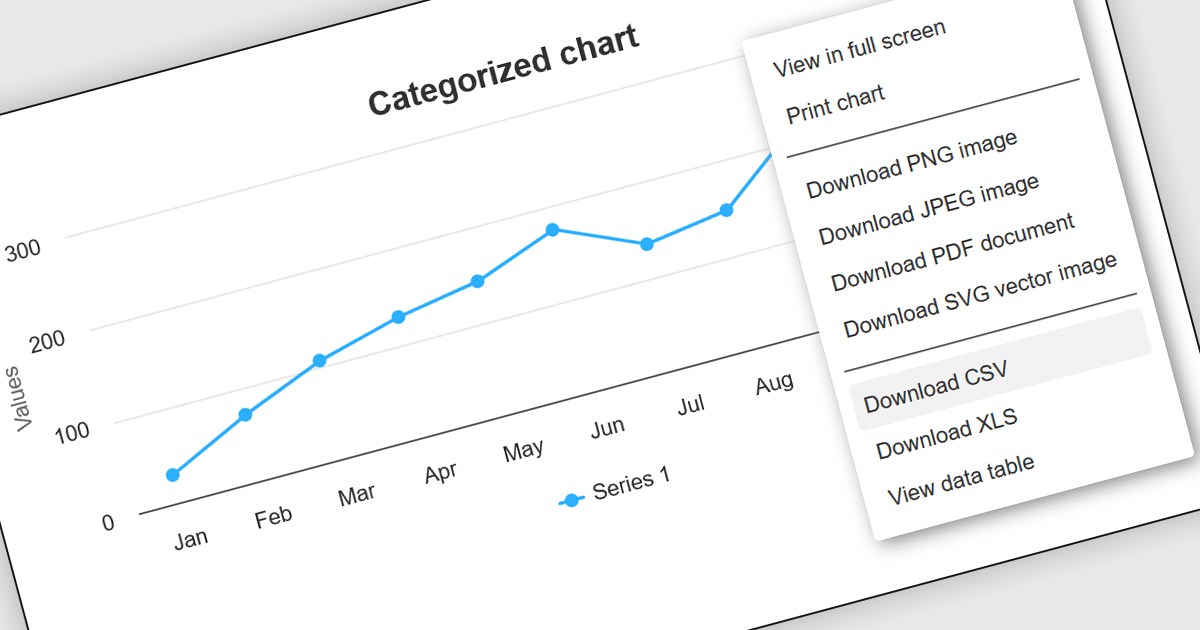
CSV export functionality in Angular chart components enables users to download the data represented in chart form as a CSV (comma-separated values) file directly from Angular-based web applications. This feature is particularly useful for developers who need to provide end-users with the flexibility to manipulate, analyze, or store chart data independently from the web interface. By integrating CSV export, applications can enhance data accessibility and user satisfaction, allowing for data transfer and offline analysis. This functionality also supports better data management practices and can be vital in environments where data needs to be shared across different platforms or systems, thereby increasing the interoperability and practical utility of the application.
Several Angular chart controls offer export to CSV including:
For an in-depth analysis of features and price, visit our comparison of Angular chart controls.
전화 : 00798 14 800 6332
팩스 : +1 770 250 6199


