


공식 공급 업체
200 이상의 소프트웨어 개발처와 판매 계약을 맺은 공인 디스트리뷰터로서 합법적인 라이선스를 제공합니다.
모든 브랜드 보기.
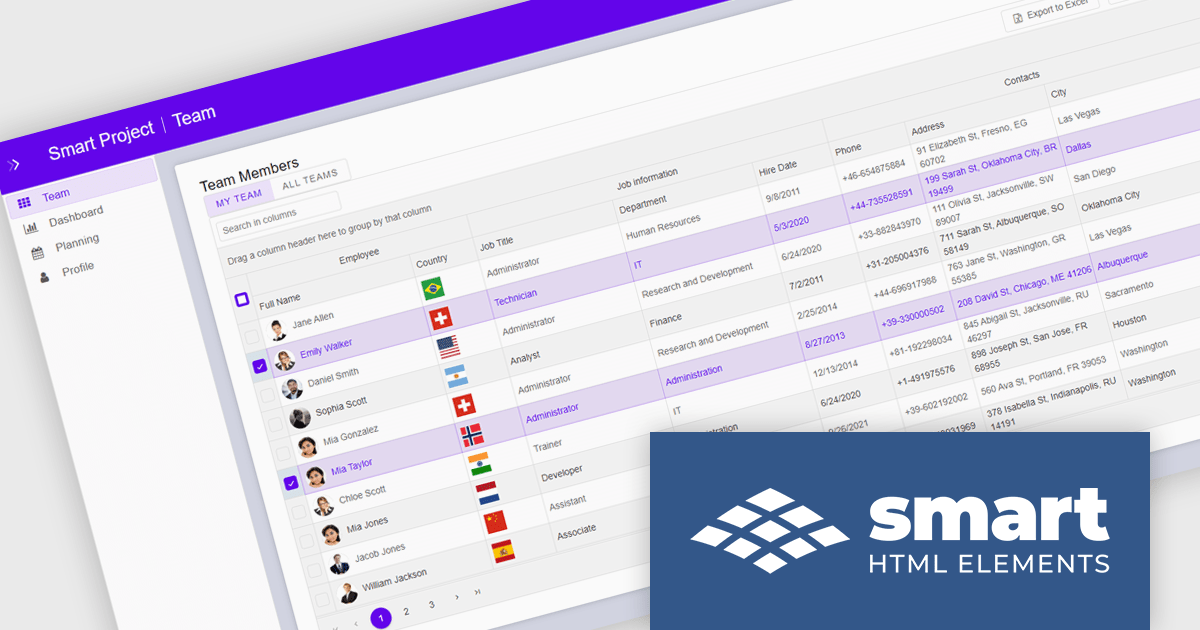
Smart UI by Smart HTML Elements is an enterprise-grade UI library offering pre-built web components for developers in Angular, React, Vue, Blazor, and JavaScript. It boasts over 60 ready-to-use components like grids, charts, schedulers, and editors, all featuring two-way data binding, responsiveness, accessibility, and theming capabilities. This library helps developers rapidly build dynamic and modern web applications with consistent look-and-feel and rich functionalities, accelerating development time and ensuring professional quality.
The Smart UI v26.0.0 update introduces native Data Grid cell comments, enabling software developers to build more collaborative applications with contextual feedback and data annotations directly within tabular interfaces. This feature improves communication during data reviews, validation workflows, and approval processes by allowing users to attach comments to specific cells without relying on external tools or custom implementations.
To see a full list of what's new in v26.0.0, see our release notes.
Smart UI (Smart HTML Elements) is licensed per developer and is available as a perpetual license with 1 year support and maintenance. It includes distribution to unlimited Web applications, SaaS projects, Intranets and Websites. Team, OEM and Enterprise licensing options are also available. See our Smart UI (Smart HTML Elements) licensing page for full details.
Learn more on our Smart UI (Smart HTML Elements) product page.
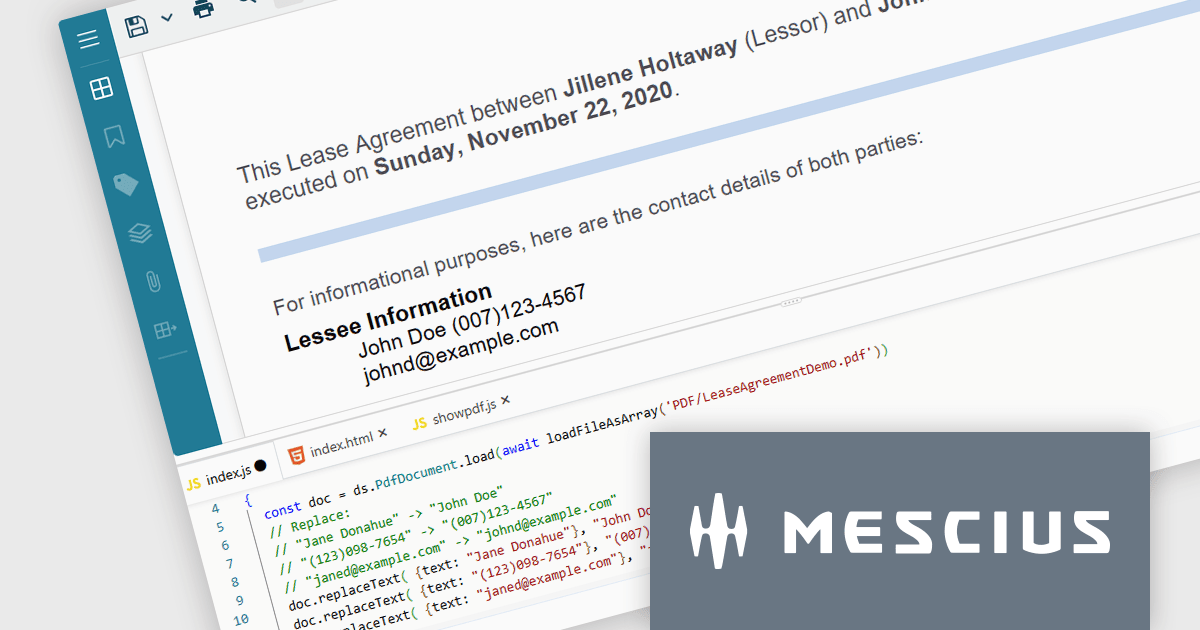
Document Solutions for PDF JS by MESCIUS is a JavaScript PDF API that enables software teams to add PDF functionality to web applications. It supports use cases such as generating documents, modifying existing files, rendering pages, handling forms, converting content, and automating PDF-related processes across browser-based and server-side JavaScript environments.
Beyond core document processing, the product provides tools for creating richer document workflows within custom applications. Its WebAssembly-based engine is designed for efficient performance, while the optional viewer component supports interactive scenarios such as annotation, review, and form filling. This gives teams more control over how PDFs are handled and helps reduce reliance on separate PDF software in reporting, compliance, data collection, and collaboration scenarios.
Document Solutions for PDF JS is licensed per developer and is available in several license options for differing distribution needs. Team licenses are also available for multiple developers within the same organization. See our Document Solutions for PDF JS licensing page for full details.
Learn more on our Document Solutions for PDF JS product page.
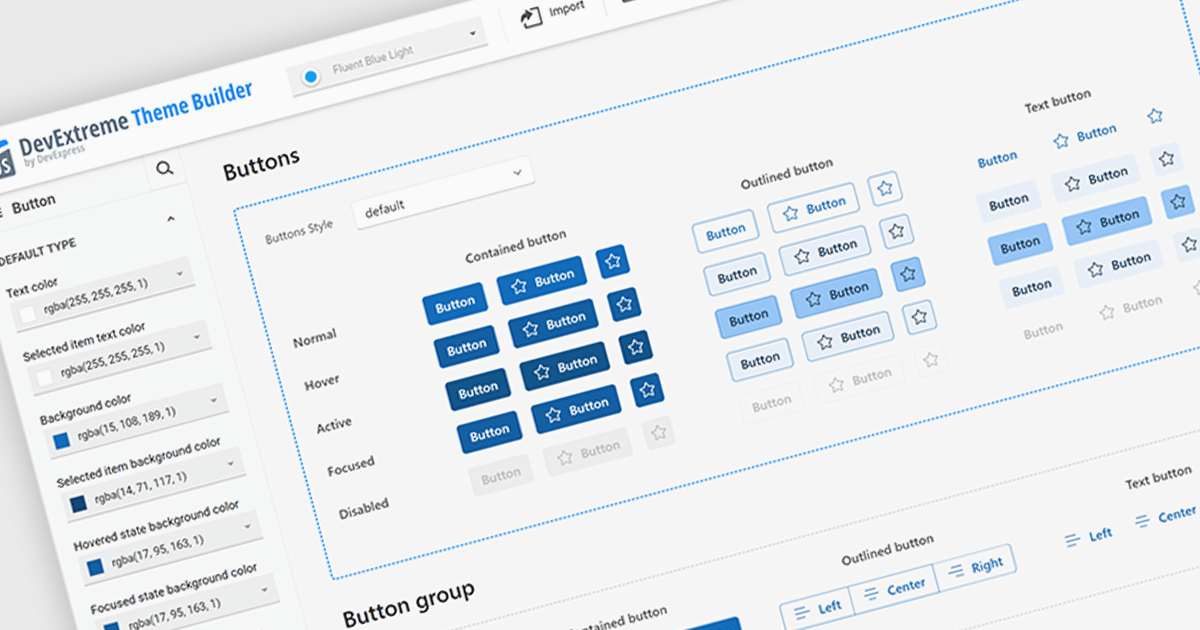
Theming support in UI component suites refers to the capability to define and apply consistent visual styles, such as colors, typography, spacing, and component appearances across an entire application. It typically allows developers to customize or switch themes dynamically, enabling alignment with branding requirements or user preferences without modifying core component logic. This separation of styling from functionality improves maintainability, reduces duplication, and accelerates development by promoting reuse, while also supporting scalability as design systems evolve and new themes are introduced.
Several Angular UI suites offer theming including:
For an in-depth analysis of features and price, visit our Angular UI suites comparison.
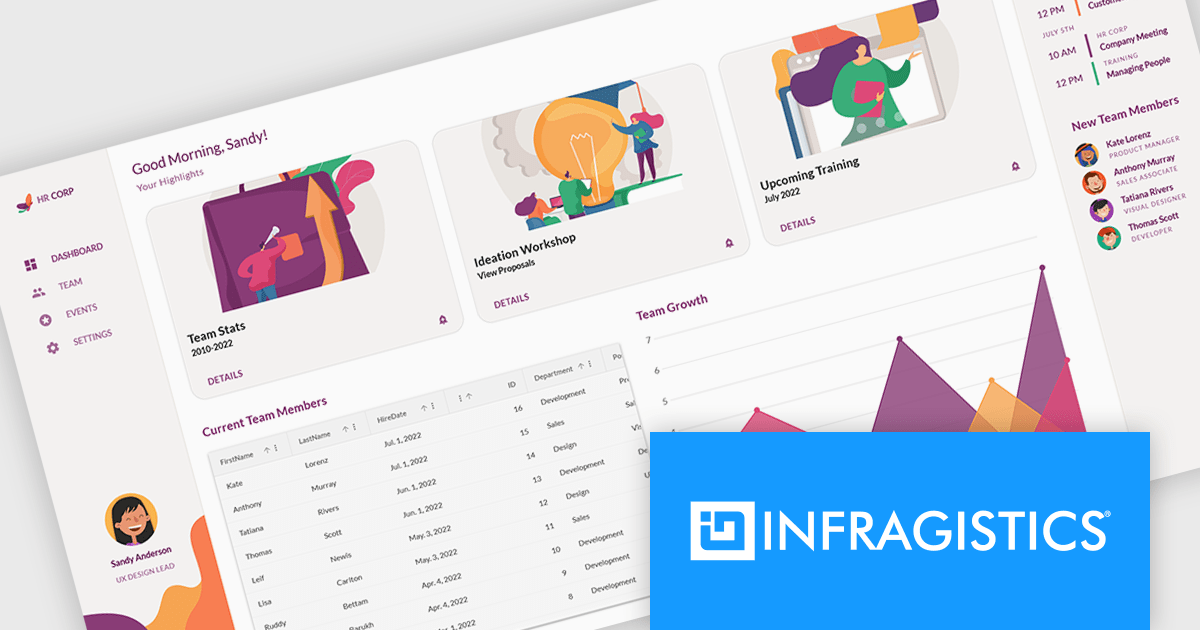
Infragistics Ignite UI is a collection of user interface components, frameworks, and development tools designed to help developers build modern web applications. It includes ready-to-use elements such as data grids, charts, and layout components for frameworks like Angular and React, along with tooling to simplify project setup and configuration. The focus is on handling complex data-heavy interfaces efficiently while maintaining performance, accessibility, and a consistent user experience across applications.
The Ignite UI CLI release includes a new Model Context Protocol (MCP) server that exposes documentation, API references, and scaffolding to tools like GitHub Copilot, Cursor and JetBrains AI Assistant. There is also support for generating code from images, making it easier to move from design to implementation. Angular templates have been refreshed, React templates expanded, and older project types removed to keep the setup process more focused.
Infragistics Ignite UI is licensed per developer and is available as a Perpetual License with a 1, 2 or 3 year support and maintenance subscription. See our Infragistics Ignite UI licensing page for full details.
Infragistics Ignite UI is available in the following products:
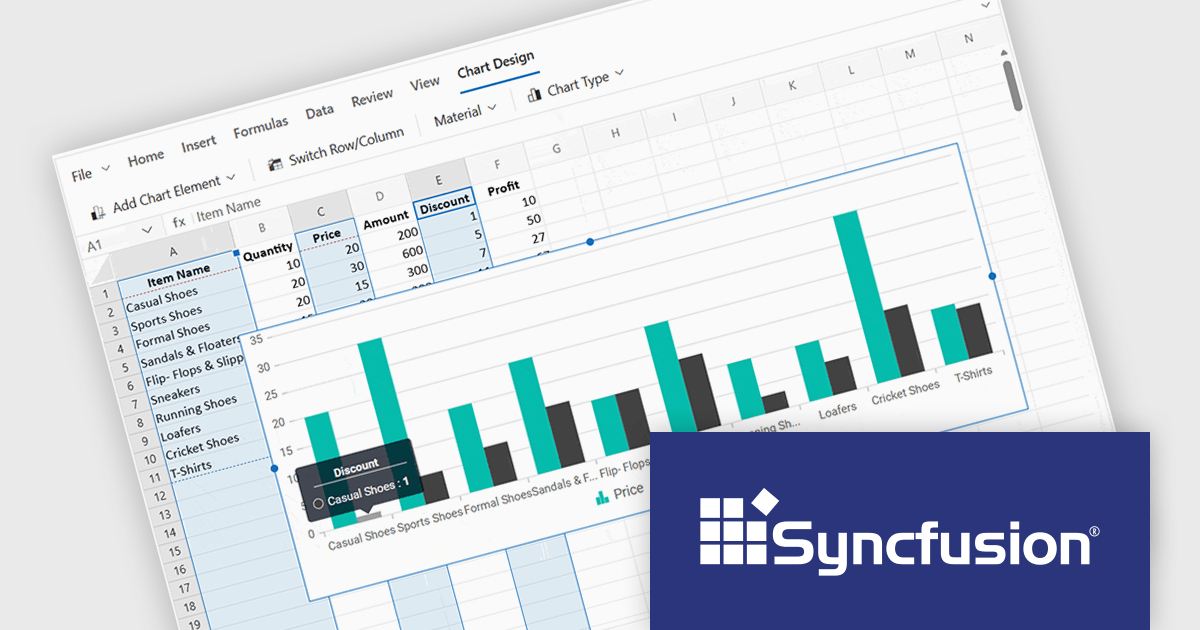
Syncfusion Essential Studio Spreadsheet Editor SDK is a library that lets developers embed spreadsheet functionality into web and desktop applications without requiring Microsoft Excel. It supports editing, formatting, and data analysis features such as cross sheet formula calculation, data binding to local and remote sources including JSON and REST, conditional cell styling, charts, data validation, worksheet protection, and workbook permissions. Available across frameworks including Blazor, React, Angular, Vue, JavaScript, ASP.NET Core and MVC, WPF and WinForms, it helps teams deliver a familiar spreadsheet experience for use cases like reporting, budgeting, and forecasting directly within their applications.
The Syncfusion Essential Studio Spreadsheet Editor SDK 2026 Volume 1 update introduces discontinuous chart range support, enabling developers to create charts from multiple non-adjacent rows, columns, or cell ranges without modifying the original data structure. This capability provides greater flexibility when working with complex, fragmented, or selectively relevant datasets, eliminating the need for manual data consolidation or duplication. It also ensures that charts remain automatically synchronized with updates across all referenced ranges, supporting more accurate, efficient, and maintainable data visualization within modern web and enterprise applications.
To see a full list of what's new in Syncfusion Essential Studio Spreadsheet Editor SDK 2026 Volume 1 (33.1.45), see our release notes.
Syncfusion Essential Studio Spreadsheet Editor SDK is licensed per developer on a one year timed subscription basis, with runtime royalty free redistribution included when the subscription is current, and includes one year of unlimited technical support and updates. See our Syncfusion Essential Studio Spreadsheet Editor SDK licensing page for full details.
Learn more on our Syncfusion Essential Studio Spreadsheet Editor SDK product page.
전화 : 00798 14 800 6332
팩스 : +1 770 250 6199


