


공식 공급 업체
200 이상의 소프트웨어 개발처와 판매 계약을 맺은 공인 디스트리뷰터로서 합법적인 라이선스를 제공합니다.
모든 브랜드 보기.
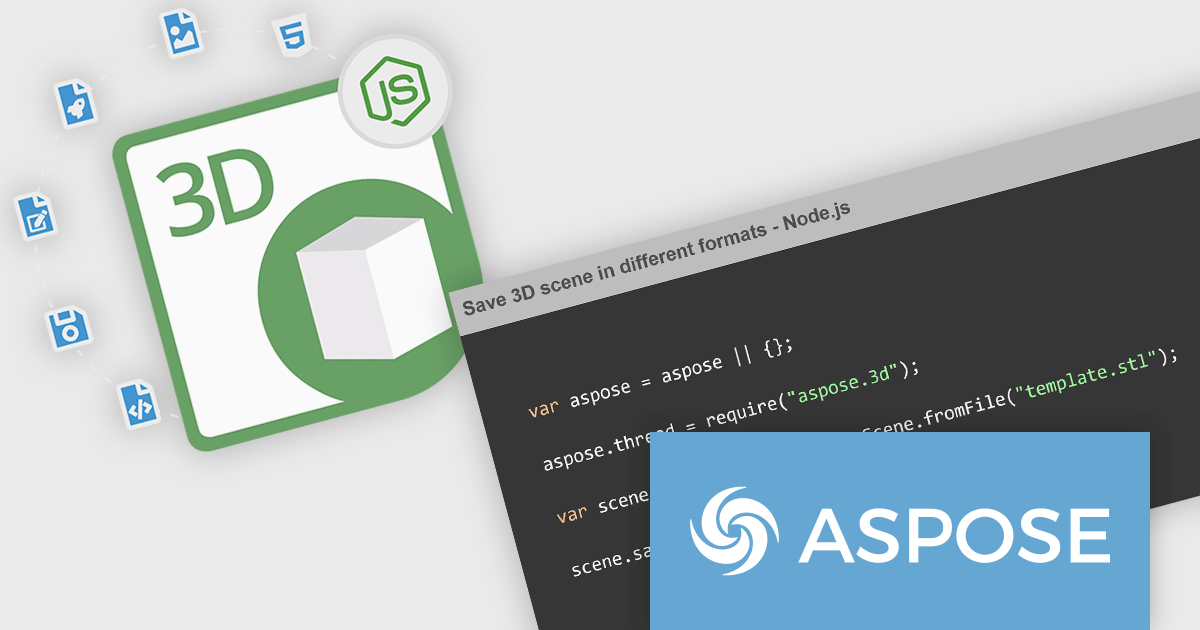
Aspose.3D for Node.js via Java is a cross-platform, server-side JavaScript (Node.js) library implemented over Java, designed for handling 3D content without needing external modeling or rendering software installed on the host. It supports reading, writing, converting, building, and modifying a wide variety of widely used 3D file formats, such as FBX, OBJ, STL, glTF/glb, Collada, Universal3D, Google Draco, and many more. The library offers a rich 3D Document Object Model (DOM) with mesh geometry, materials, textures, lighting, animation channels, scene graphs, primitives (boxes, spheres, toruses, etc.), and more. It runs on Windows, Linux, and macOS environments (with Java support) and exposes APIs for programmers to control all aspects of 3D scenes.
Aspose.3D for Node.js via Java enables automated conversion of 3D files from one format to another, useful in pipelines that produce assets for web, games, AR/VR, or 3D printing, without needing external tools or manual intervention. Its ability to alter meshes, share geometry, define animations, and manipulate scene hierarchy means it can be used in custom 3D authoring, asset pipelines, or anywhere dynamic generation of 3D content is required. Also, because it is self-contained and works purely via code, it supports integration into CI/CD, cloud environments, or headless servers for processing 3D assets (for example, rendering previews, generating thumbnails, or applying watermarking). Finally, its support for many formats and robust DOM model reduce development overhead and risks when working with diverse 3D content sources.
Aspose.3D for Node.js via Java is offered as Developer Small Business, Developer OEM, Developer SDK, Site Small Business, Site OEM and Site SDK licenses catering to a range of business needs. Licenses are perpetual, and include 1 year of support and maintenance. Subscription renewals are also available. See our Aspose.3D for Node.js via Java licensing page for full details.
Aspose.3D for Node.js via Java is available individually or as part of the following products:
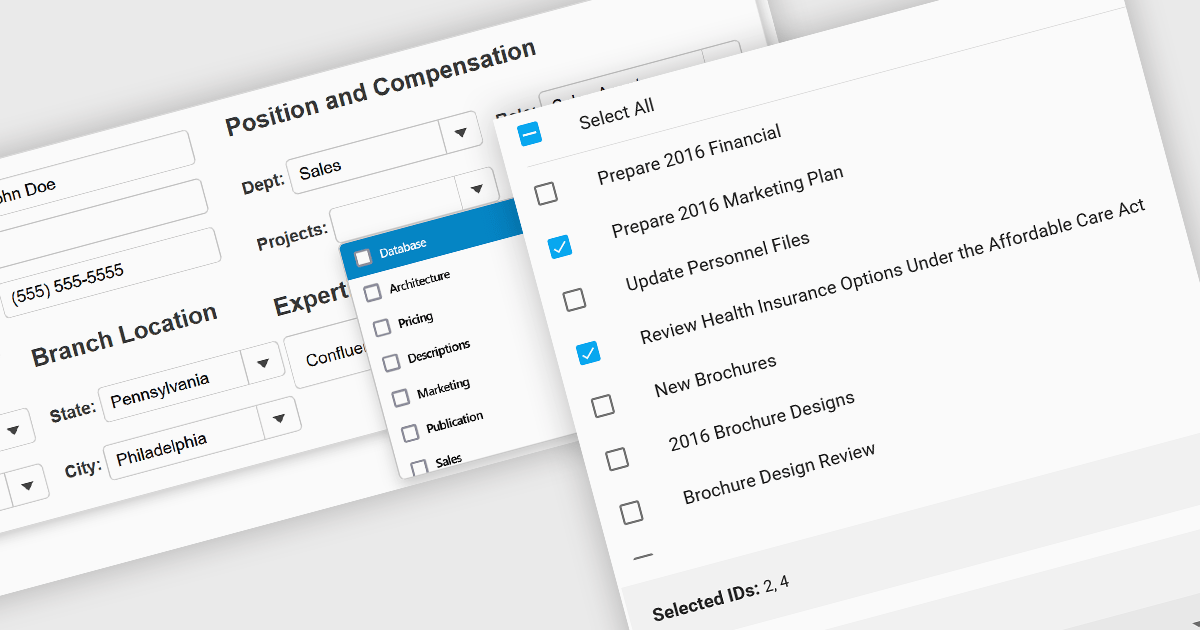
Checked listboxes provide users with a convenient interface for selecting multiple items within data editor controls. They enhance user workflows by combining the visual clarity of list presentations with the functionality of checkboxes, enabling intuitive multi-selection capabilities. Typically data-bound, these controls support both manual and programmatic manipulation of items, including checking, unchecking, and layout customization, facilitating dynamic and interactive list management in enterprise-grade applications.
Several Vue.js data editor collections include a checked listbox, including:
For an in-depth analysis of features and price, visit our Vue.js data editors comparison.
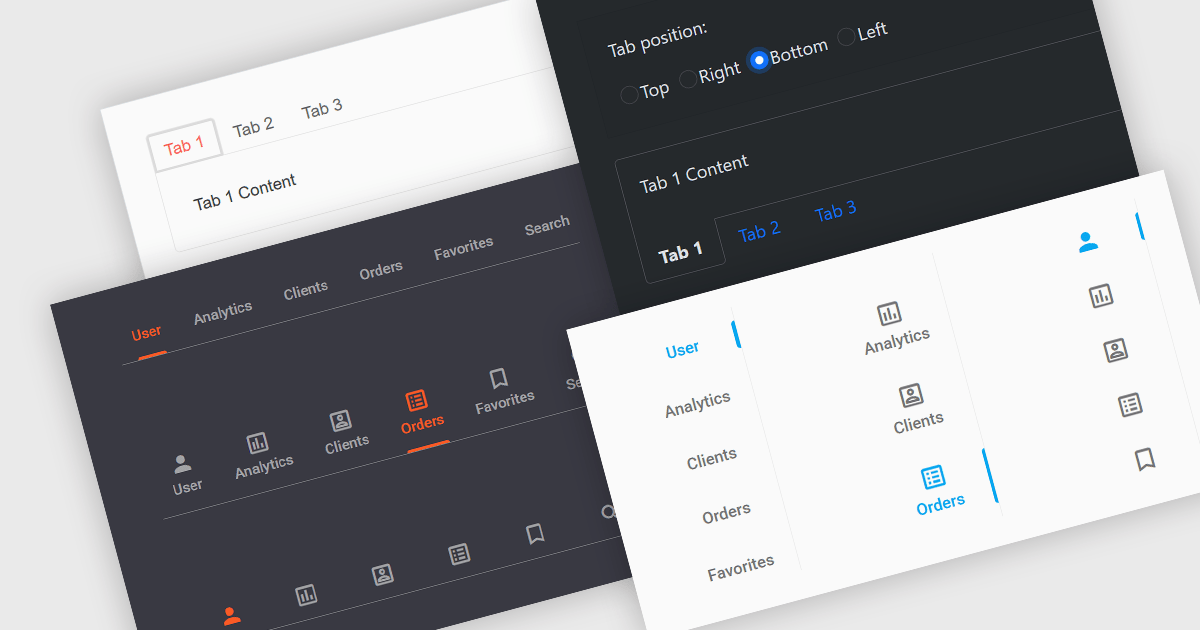
Tabs are a common user interface element that allows users to navigate between multiple sections or views within the same window by clicking on labeled tabs, typically displayed in a row. Each tab presents a different set of information or controls, helping to organize content in a way that reduces clutter and makes it easier to find relevant features without switching between multiple windows or pages. Creating a tabbed UI to switch between sections provides faster access to key areas, and improves usability by maintaining context. This approach is especially useful in applications with layered data or multiple tool sets, where managing space and context is critical.
Several Angular UI suites provide you with tab functionality, including:
For an in-depth analysis of features and price, visit our comparison of Angular UI suites.
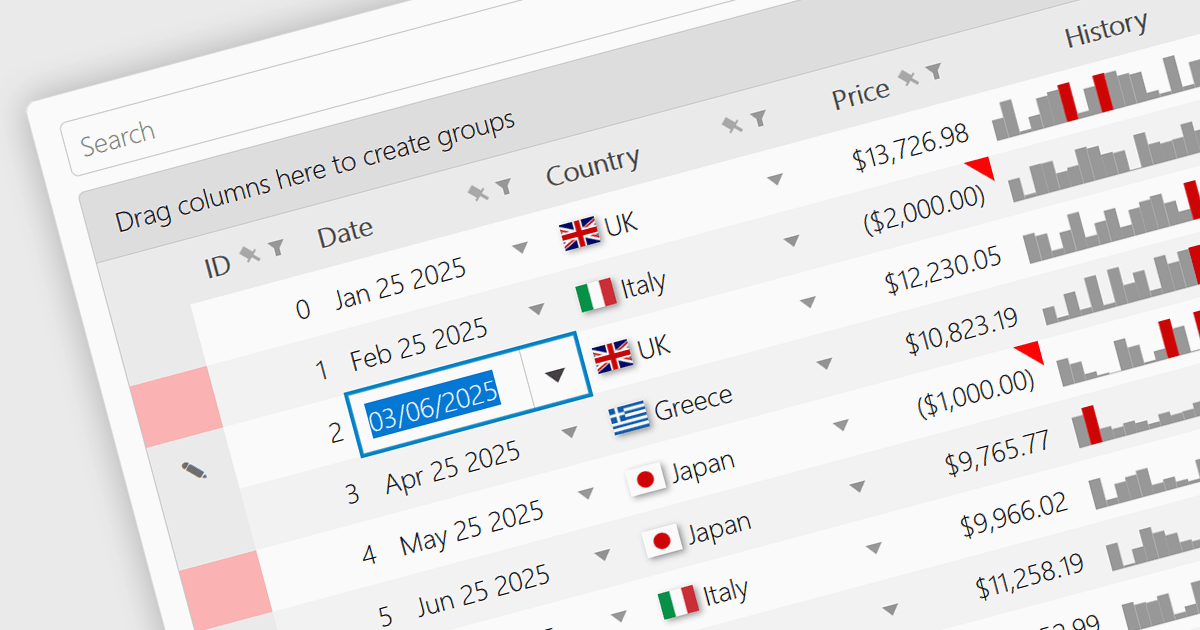
A date/time cell type in a JavaScript Grid control lets developers manage temporal data more effectively by treating input as actual JavaScript Date objects rather than plain text. This enables built-in features like calendar popups, time pickers, and structured output formats such as "09/09/2025" or "Sep 9 2025", making it easier for users to interact with the data accurately. It's especially useful in applications that rely on scheduling, activity logs, or time-driven reports. Most modern grid libraries also support localization, formatting, and input validation to ensure the cell behavior fits seamlessly with the application's design and data standards.
Several JavaScript Grid controls offer support for Date/Time cell types including:
For an in-depth analysis of features and price, visit our comparison of JavaScript Grid controls.
Kendo UI is a comprehensive suite of four JavaScript UI libraries for Angular, React, Vue and jQuery that enables developers to build responsive web applications for desktop, tablet, and mobile platforms with minimal effort. It provides a wide range of customizable components such as data grids, charts, schedulers, and form controls that streamline development and can significantly reduce time to market. With built-in support for theming, accessibility, localization, and state management, Kendo UI is ideal for creating data-driven dashboards, CRM systems, e-commerce portals, and administrative interfaces while maintaining high performance and a consistent user experience.
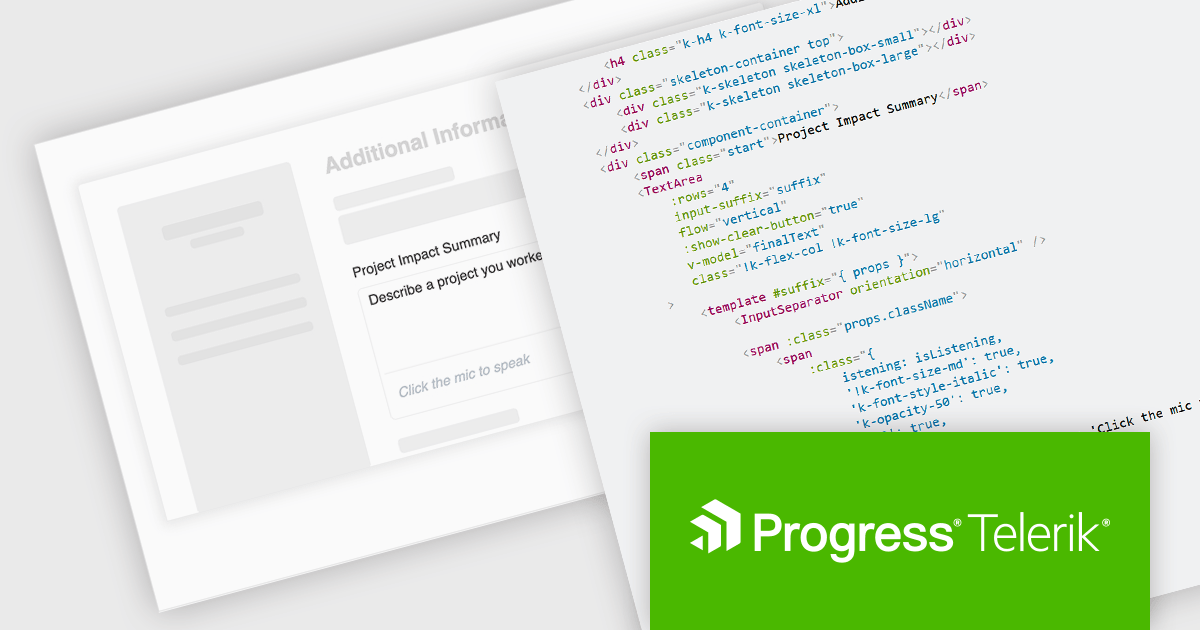
The Kendo UI 2025 Q3 update adds a speech to text button component to its Angular, React, Vue and jQuery libraries. These ready to use components facilitate voice‑driven text input directly within the application, converting speech into text so, with just a single click, users can speak instead of typing. It uses the browser's native Web Speech API and supports over 100 languages with automatic locale detection. Developers also benefit from full control over visual styling, including icons, colors, sizes, fill modes, rounded corners, and CSS, and integration hooks through built‑in states and events, making it straightforward to provide rich voice‑enabled experiences or connect to external AI services.
To see a full list of what's new in 2025 Q3, see our release notes.
KendoReact and Kendo UI are both licensed per developer and share two licensing models: an annual Subscription License and a Perpetual License. The Subscription license provides access to the latest product updates, technical support, and exclusive benefits for a flat annual fee, and must be renewed to continue using the software. The Perpetual license is a one-time purchase granting access to the current released version and includes a one-year subscription for product updates and technical support. After this initial period, users can choose to renew the subscription element to continue receiving updates and support; otherwise, they may continue using the installed version available during their active subscription term but will forgo future updates and support. See our Kendo UI licensing page for full details.
The React library is available individually as KendoReact, while all four Kendo UI libraries are available in the following products:
전화 : 00798 14 800 6332
팩스 : +1 770 250 6199


