


공식 공급 업체
200 이상의 소프트웨어 개발처와 판매 계약을 맺은 공인 디스트리뷰터로서 합법적인 라이선스를 제공합니다.
모든 브랜드 보기.
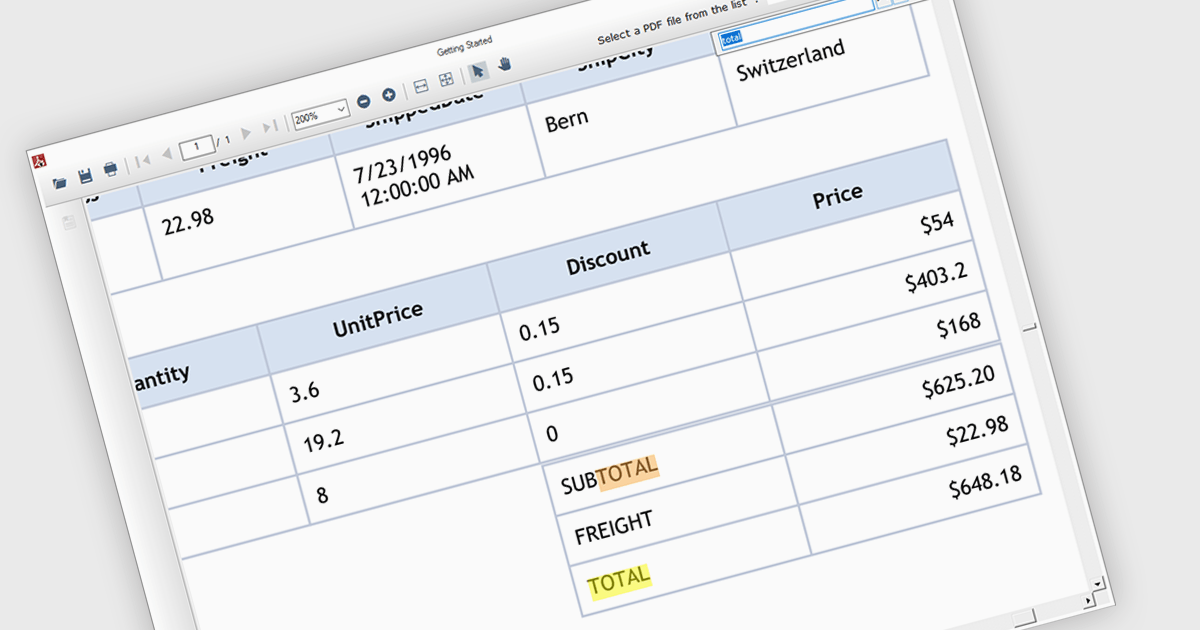
Text search functionality in PDF components enables developers to integrate a search bar or button within their application, allowing users to find specific terms or phrases within a loaded PDF document. This empowers users to quickly locate relevant information, improving efficiency and user experience. Text search is particularly beneficial for applications dealing with large or complex PDFs, such as legal documents, research papers, or technical manuals.
Several .NET WinForms PDF components offer support for text searching including:
For an in-depth analysis of features and price, visit our WinForms PDF Components comparison.

Trend lines are essential tools in data visualization and financial analysis, used to identify and interpret the direction and strength of trends in data sets. A trend line is a line that best represents the data on a chart, highlighting the general direction over a specified period. This is beneficial for making informed decisions, predicting future price movements, and validating the strength of ongoing trends. In stock market analysis, a trend line can help investors determine optimal entry and exit points, while moving averages can signal buy or sell opportunities, enhancing the effectiveness of trading strategies.
Several .NET WinForms chart controls offer trend lines and indicators including:
For an in-depth analysis of features and price, visit our comparison of .NET WinForms chart controls.
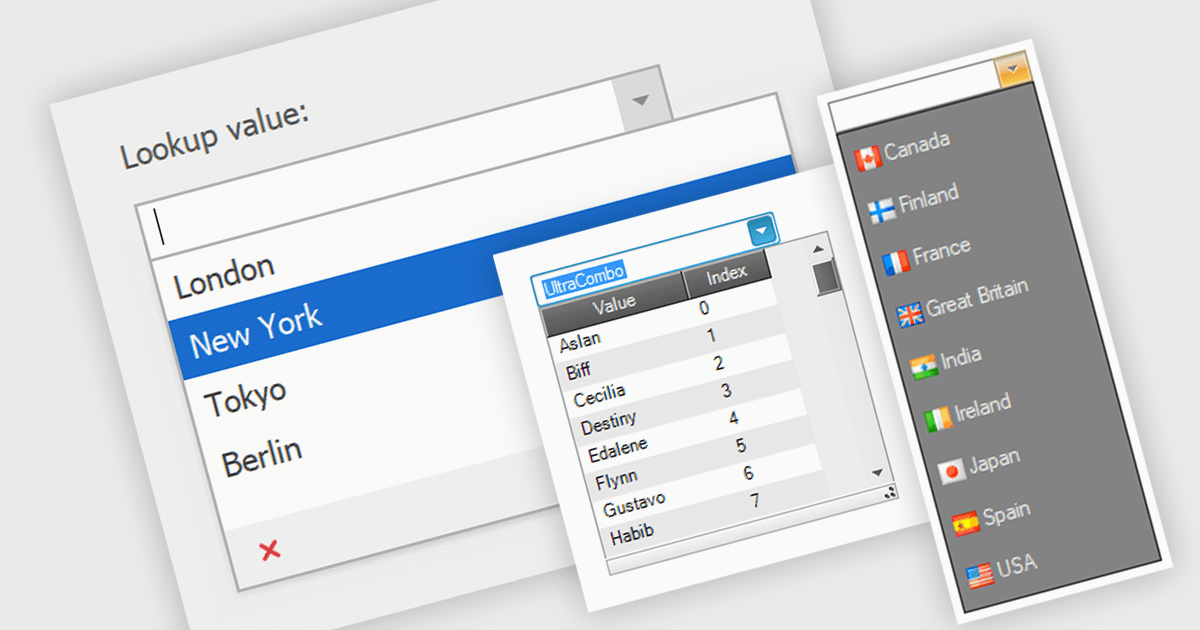
Comboboxes are user interface elements that provide a flexible input experience. They combine a text field with a drop-down list, allowing users to either choose a value from the pre-defined options or enter their own custom value directly into the field. This functionality makes them particularly useful for selecting from large datasets or enabling data entry that may not always have a perfect match within a predefined list.
Several WinForms data editor collections offer combobox components including:
For an in-depth analysis of features and price, visit our WinForms Data Editors comparison.
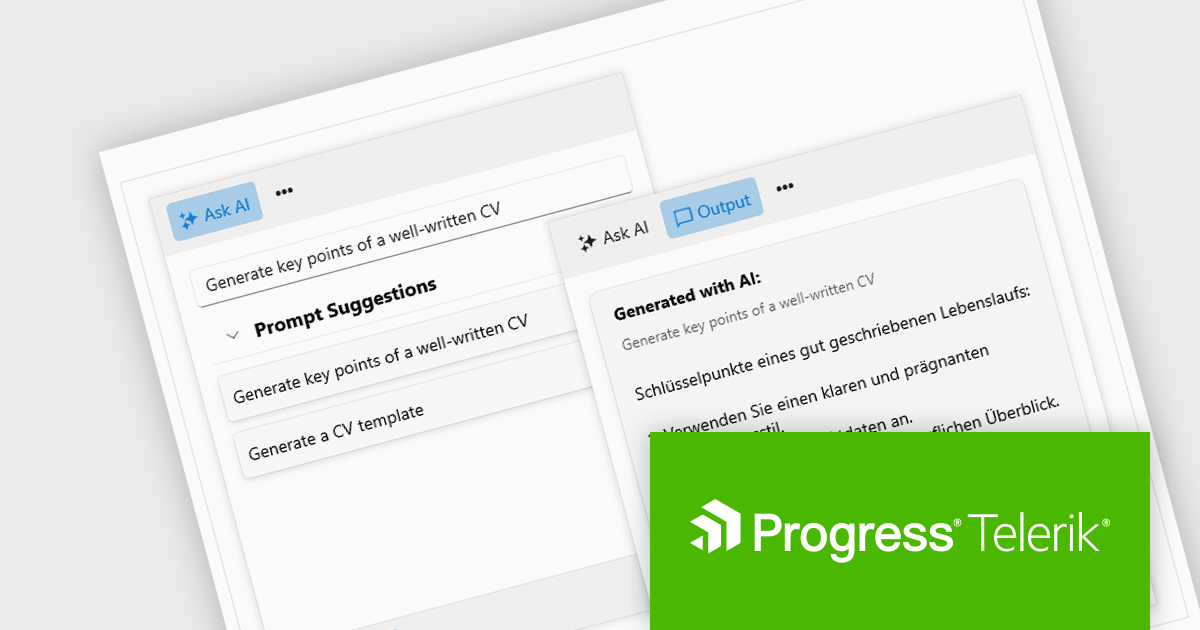
Progress Telerik is a leading software publisher that provides a range of tools and solutions to help developers build and deploy modern applications. Its product range include UI libraries, reporting tools and testing frameworks. Telerik products are used by millions of developers around the world to build a wide variety of applications.
The 2024 Q2 release completes the blending of AI with UI, thereby bridging the gap between an app and next-generation AI language model applications. The new "AIPrompt" component allows you to integrate artificial intelligence prompts into web, mobile and desktop applications, providing users with a modern interface to interact with AI services.
The following Telerik products have been updated with the AI Prompt component:
To see what else is new in 2024 Q2, see our release notes:
Telerik products are licensed per developer and are available as perpetual licenses with a one year support subscription, which is available in three tiers: Lite, Priority or Ultimate. For more information see:
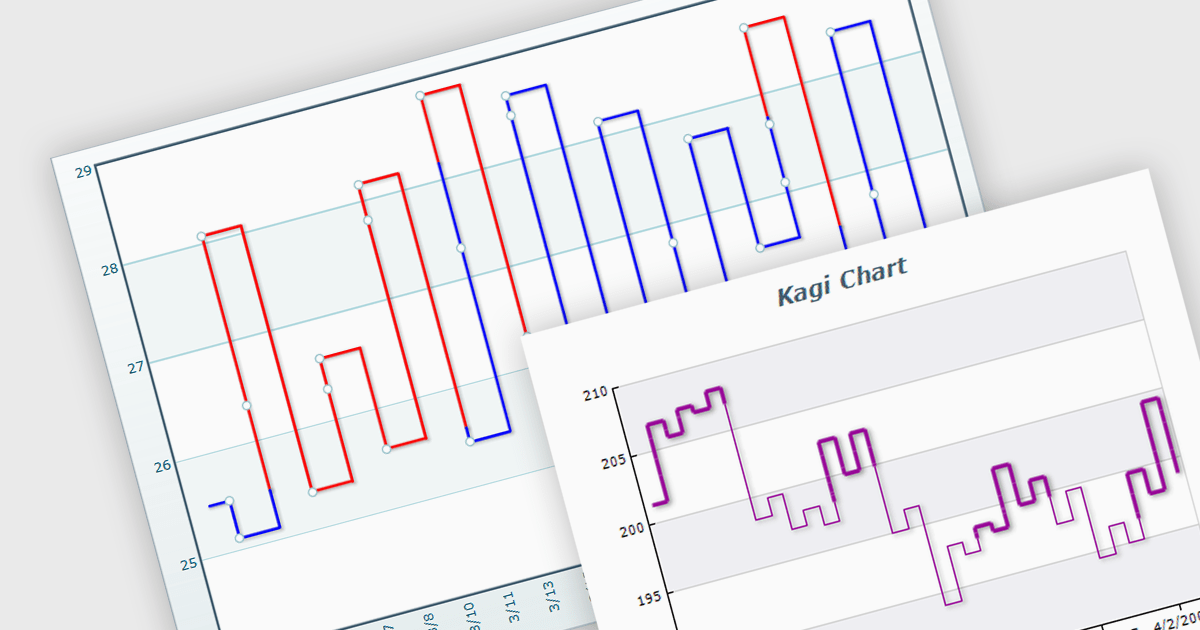
A Kagi chart is a type of financial chart used to track price movements, with a focus on significant trends and reversals rather than minor fluctuations, to inform stock purchasing decisions. It features a series of vertical lines that reflect changes in price. The direction of these lines shifts only when the price moves by a predetermined amount, known as the reversal amount. Thin lines indicate that the price has fallen below the previous low while thick lines indicate that the price has surpassed the previous high. By filtering out minor price fluctuations it emphasises substantial price movements, offering a clearer perspective on market trends.
Several WinForms chart components provide Kagi charts, including:
For an in-depth analysis of features and price, visit our WinForms charts comparison.
전화 : 00798 14 800 6332
팩스 : +1 770 250 6199


