


공식 공급 업체
200 이상의 소프트웨어 개발처와 판매 계약을 맺은 공인 디스트리뷰터로서 합법적인 라이선스를 제공합니다.
모든 브랜드 보기.
Progress Telerik is a leading software publisher that provides a range of tools and solutions to help developers build and deploy modern applications. Its product range include UI libraries, reporting tools and testing frameworks. Telerik products are used by millions of developers around the world to build a wide variety of applications.
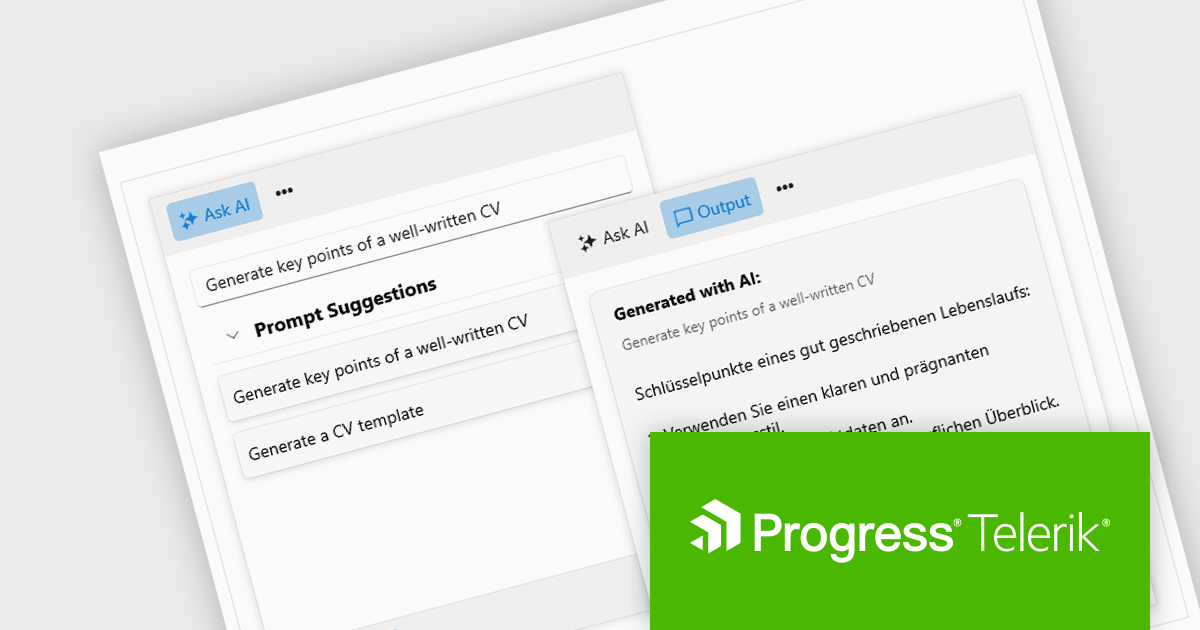
The 2024 Q2 release completes the blending of AI with UI, thereby bridging the gap between an app and next-generation AI language model applications. The new "AIPrompt" component allows you to integrate artificial intelligence prompts into web, mobile and desktop applications, providing users with a modern interface to interact with AI services.
The following Telerik products have been updated with the AI Prompt component:
To see what else is new in 2024 Q2, see our release notes:
Telerik products are licensed per developer and are available as perpetual licenses with a one year support subscription, which is available in three tiers: Lite, Priority or Ultimate. For more information see:

Incorporating a PDF component with search functionality into your application offers significant advantages. Users can locate specific information within complex documents with ease, streamlining their experience and enhancing productivity. This translates to a more user-friendly and efficient app, reducing frustration and allowing users to find what they need quickly, without the needing to install additional software.
Several WPF PDF Viewer controls allow you to search for text in PDF files including:
For an in-depth analysis of features and price, visit our WPF PDF Viewer controls comparison.
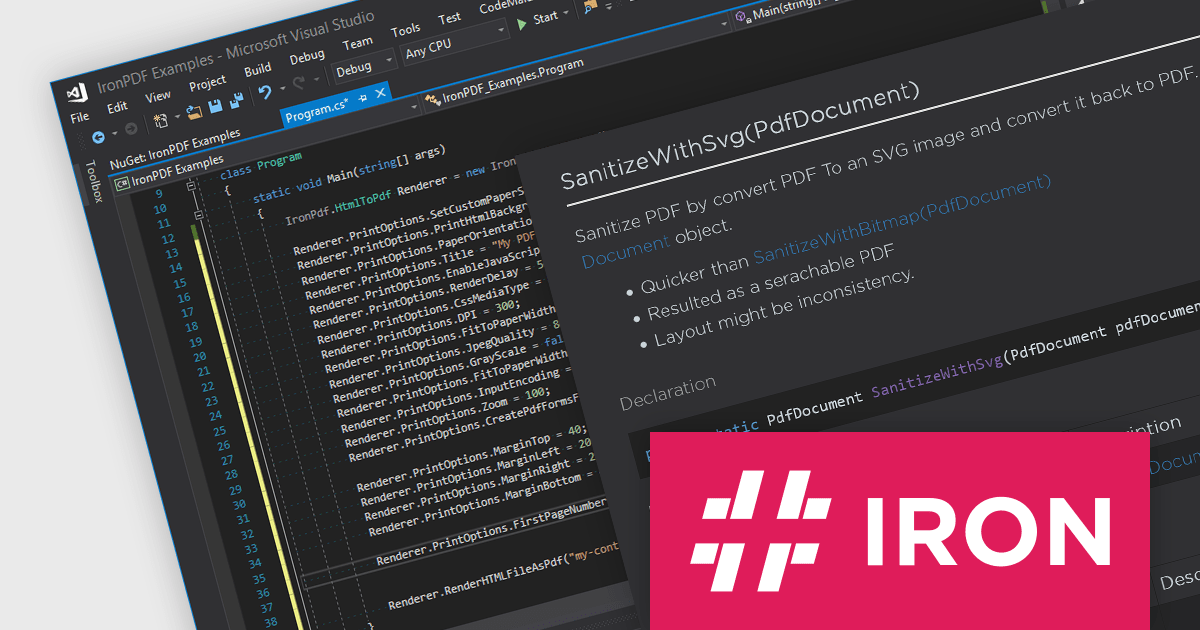
IronPDF for .NET empowers developers with a user-friendly C# library to generate, edit, and manage PDFs. It leverages a familiar HTML/CSS foundation for effortless PDF creation, while also offering robust features like text extraction, OCR, signing, and more. This comprehensive solution simplifies complex PDF development tasks, saving time and boosting productivity for .NET projects.
The IronPDF for .NET 2024.5.2 update introduces the IronPdf.Cleaner API, designed to improve the security and reliability of PDF handling in applications. This new API offers developers the capability to sanitize and scan PDF files, effectively mitigating the risks associated with processing content from an untrusted source. It removes potentially malicious code and sensitive information, such as metadata, comments, or embedded objects, that could compromise the application or user data. This enhances application security and safeguards against potential vulnerabilities introduced through untrusted PDF sources.
To see a full list of what's new in 2024.5.2, see our release notes.
IronPDF for .NET is licensed based on the number of developers, organization locations and projects, and is available as a Perpetual license with one free year of product updates and support services. See our IronPDF for .NET licensing page for full details.
IronPDF for .NET is available to buy in the following products:
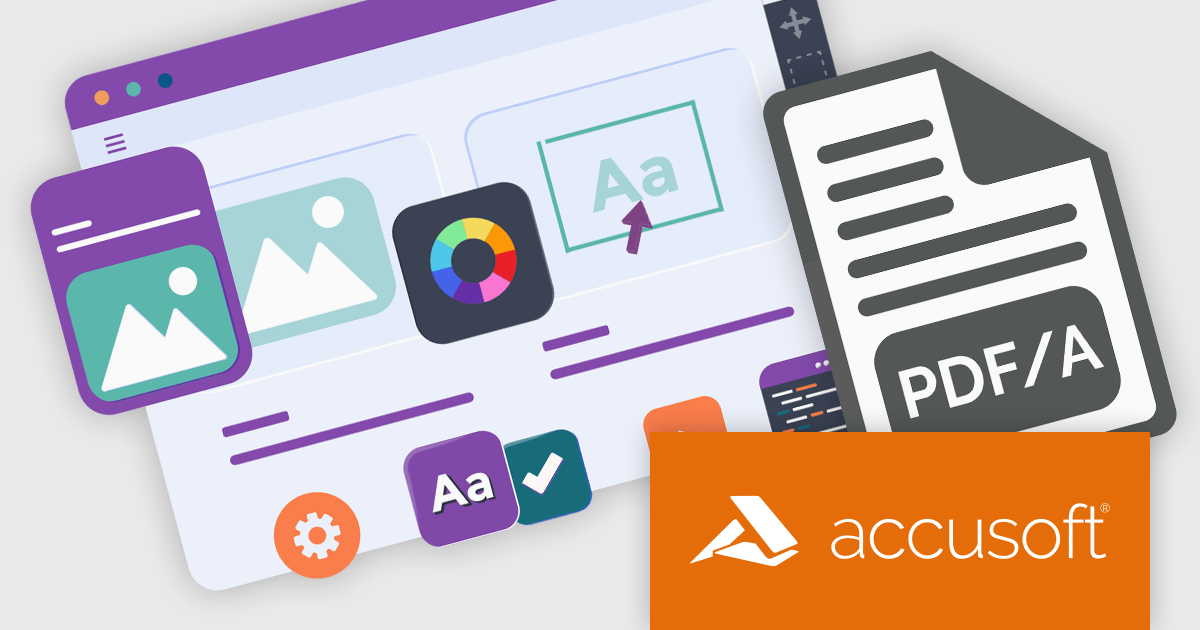
ImageGear for .NET by Accusoft is a development toolkit that empowers you to add robust image processing and document handling functionalities to your .NET applications. It provides comprehensive support for a wide range of file formats, including common image types, PDFs, DICOM medical images, and even Microsoft Office files. ImageGear offers functionalities such as conversion, editing, annotation, viewing, and OCR, streamlining your development process for document-centric applications.
The ImageGear for .NET v26.4.0 update streamlines PDF archiving with the introduction of a RESTful PDF to PDF/A Converter API. This API empowers your applications to seamlessly convert any PDF document into a fully PDF/A compliant archive format. This ensures long-term accessibility and fidelity of your documents, meeting industry standards for preservation.
To see a full list of what's new in v26.4.0, see our release notes.
ImageGear for .NET is licensed per developer and is available as an annual license with 12 months support and upgrades. See our ImageGear for .NET licensing page for full details.
For more information, see our ImageGear for .NET product page.
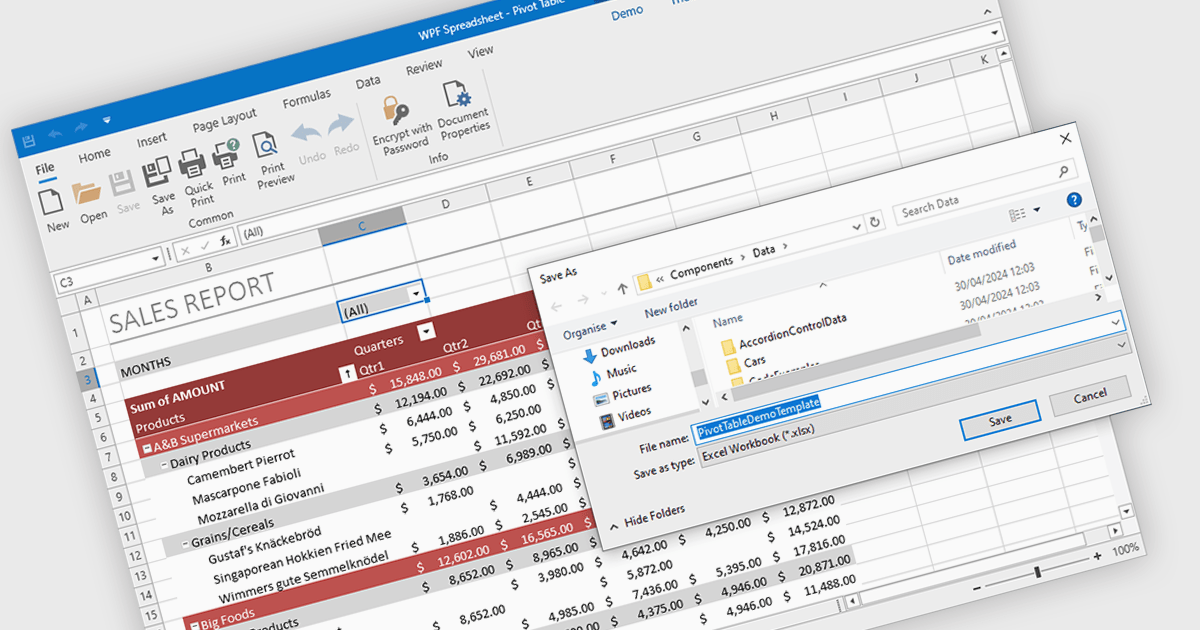
Spreadsheet components with XLSX export functionality allow developers to seamlessly save spreadsheet data and formatting from their application as a Microsoft Excel compatible file. This functionality provides significant benefits such as increased data portability for users who can then open and edit the spreadsheets in Excel, and improved collaboration as data can be easily shared and worked on across different platforms.
Several WPF spreadsheet controls offer the ability to export XLSX files including:
For an in-depth analysis of features and price, visit our WPF spreadsheet controls comparison.
전화 : 00798 14 800 6332
팩스 : +1 770 250 6199


