


공식 공급 업체
200 이상의 소프트웨어 개발처와 판매 계약을 맺은 공인 디스트리뷰터로서 합법적인 라이선스를 제공합니다.
모든 브랜드 보기.
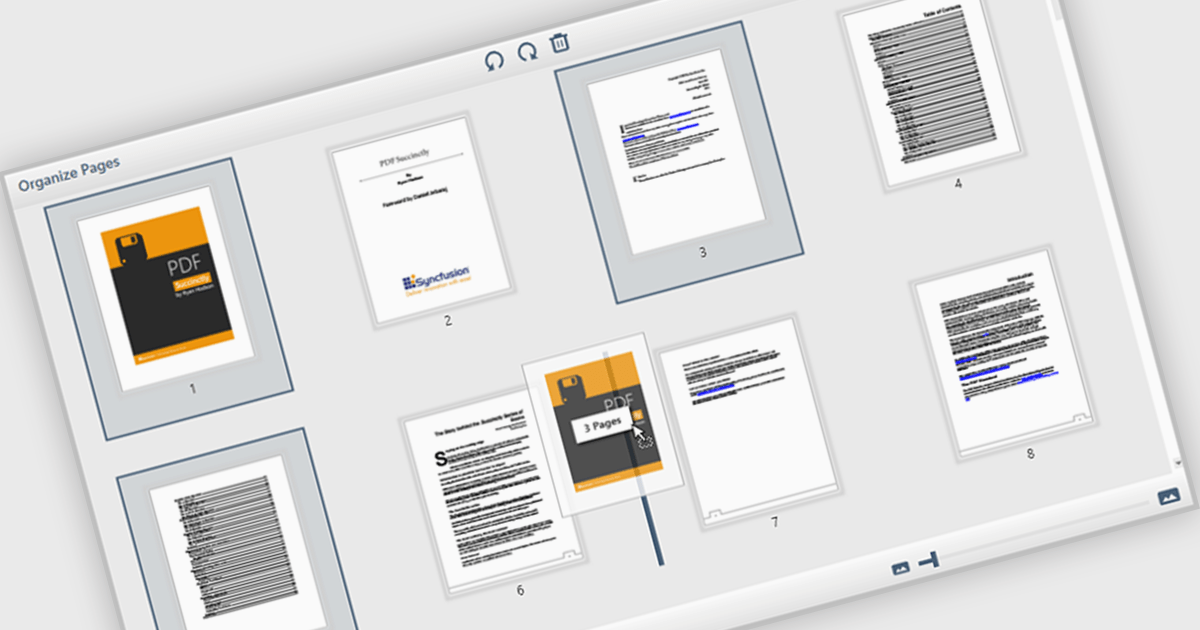
The ability to move and arrange pages in a PDF viewer allows users to reorder individual pages within a PDF document directly through the interface. For software developers, this feature supports more dynamic document processes, especially in applications involving content assembly, form management, or automated report generation. It reduces the need for external tools or manual editing, which simplifies integration and enhances user experience when managing complex or multi-page documents.
Several WPF (Windows Presentation Foundation) PDF viewer components allow you to move and arrange pages in a PDF, including:
For an in-depth analysis of features and price, visit our WPF PDF viewer comparison.
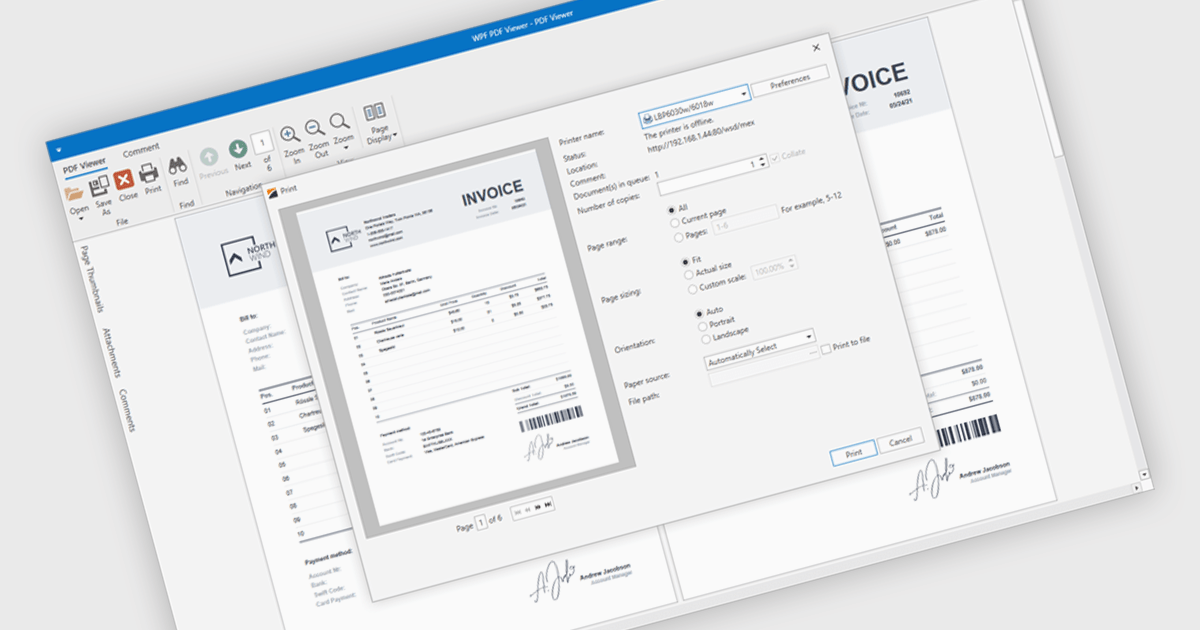
PDF printing within a PDF Viewer allows users to print documents directly from the viewing interface without needing to open external applications. This built-in functionality provides quick access to print options such as paper size, orientation, and scaling while maintaining the document’s original layout, fonts, and graphics. It ensures professional, high-quality output and a consistent user experience across different printers and devices. Common use cases include printing invoices, reports, forms, and technical documentation directly from desktop or embedded applications, helping users save time, reduce complexity, and improve productivity in document-heavy environments.
Several .NET WPF PDF viewer components include support for printing, including:
For an in-depth analysis of features and price, visit our comparison of .NET WPF PDF viewer components.
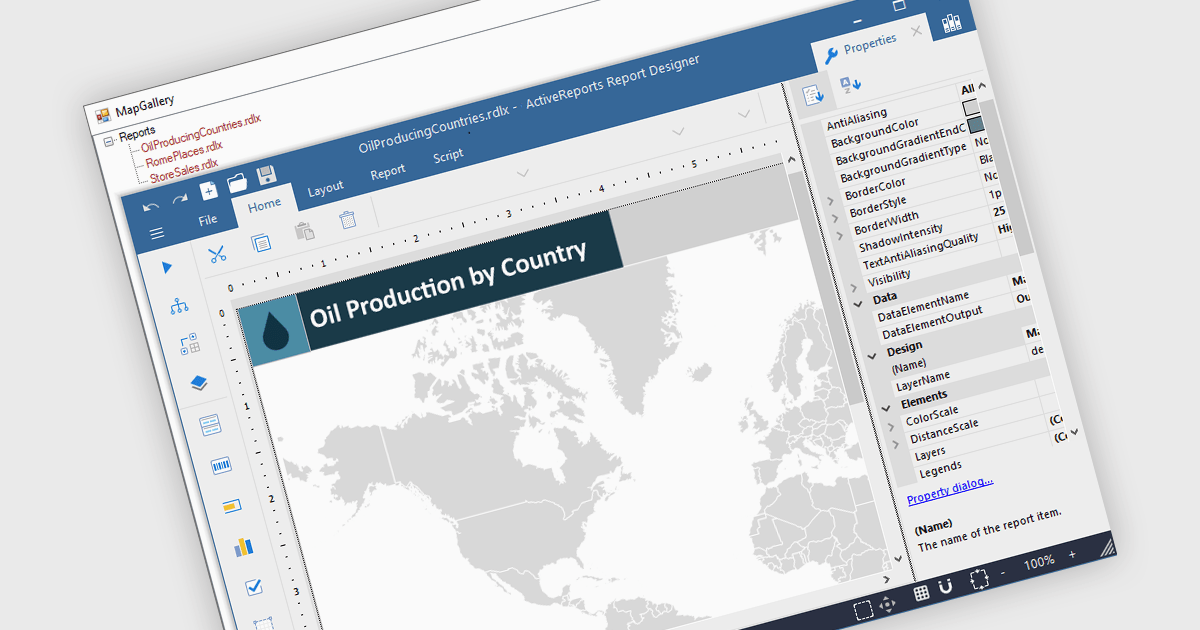
Maps in reports enable data to be visualized geographically, turning raw numbers into clear, location-based insights that are easy to interpret. By integrating maps, reports can highlight regional trends, patterns, and relationships that might be overlooked in traditional charts or tables. This spatial perspective supports better decision-making by revealing where performance is strongest, where opportunities exist, and where challenges may be emerging. Common use cases include visualizing sales performance by region, tracking service coverage areas, monitoring logistics routes, and presenting demographic or environmental data. Incorporating maps adds depth, context, and visual appeal, making reports more informative and engaging for any audience.
Several .NET WPF reporting controls offer maps, including:
For an in-depth analysis of features and price, visit our comparison of .NET WPF reporting controls.
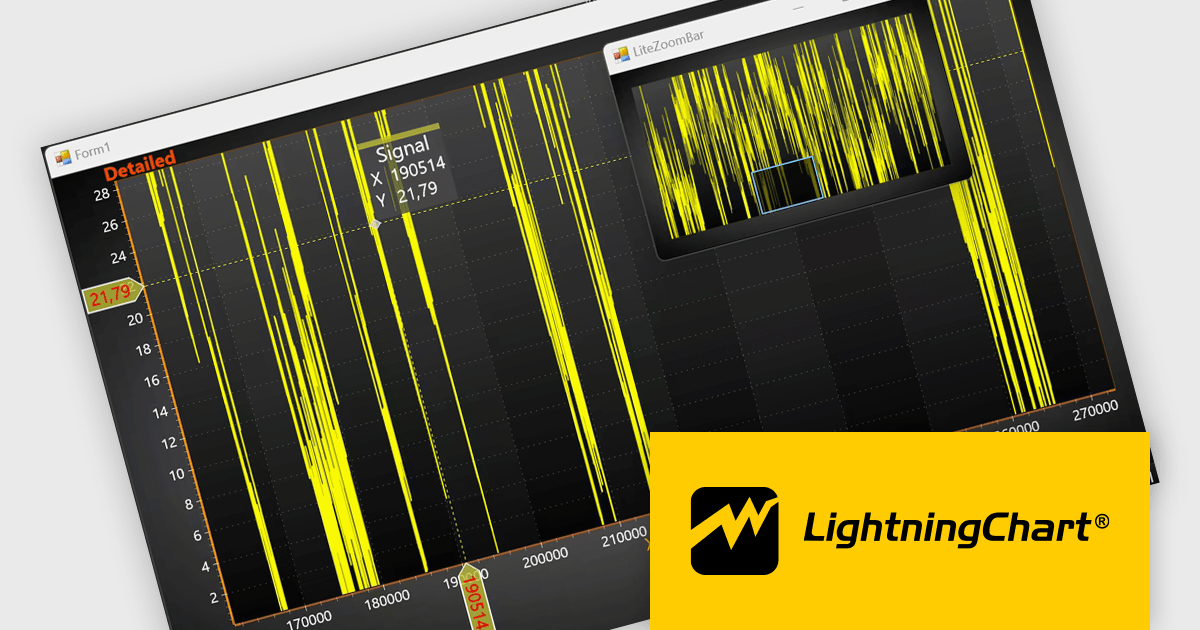
LightningChart .NET is a high-performance data visualization library designed for .NET developers working with WPF, WinForms, and UWP applications. It offers GPU-accelerated rendering for smooth real-time visualization of massive datasets, exceeding billions of data points. This library supports a wide variety of chart types, including 2D, 3D, polar, and geographic maps, along with extensive customization options for each. LightningChart .NET is a powerful tool for developers creating demanding data visualization applications requiring exceptional performance.
The LightningChart .NET v12.4.1 update enhances data visualization and navigation, allowing developers to display an overview of the entire dataset alongside a zoomed-in chart view - improving context awareness when analyzing large or complex data. The new LiteZoomBar offers a lightweight, memory-efficient alternative for applications requiring optimized performance. This tool provides greater control and efficiency in exploring and interpreting chart data.
To see a full list of what's new in v12.4.1, see our release notes.
LightningChart .NET is available per developer in packages for either WPF, WinForms, UWP or all 3. Each package comes as a subscription license (with 1 or 2 years of limited support), or a perpetual license (with 1 or 2 years of Standard or Premium support). Floating licenses and site licenses are available upon request. See our LightningChart .NET licensing page for full details.
Learn more on our LightningChart .NET product page.
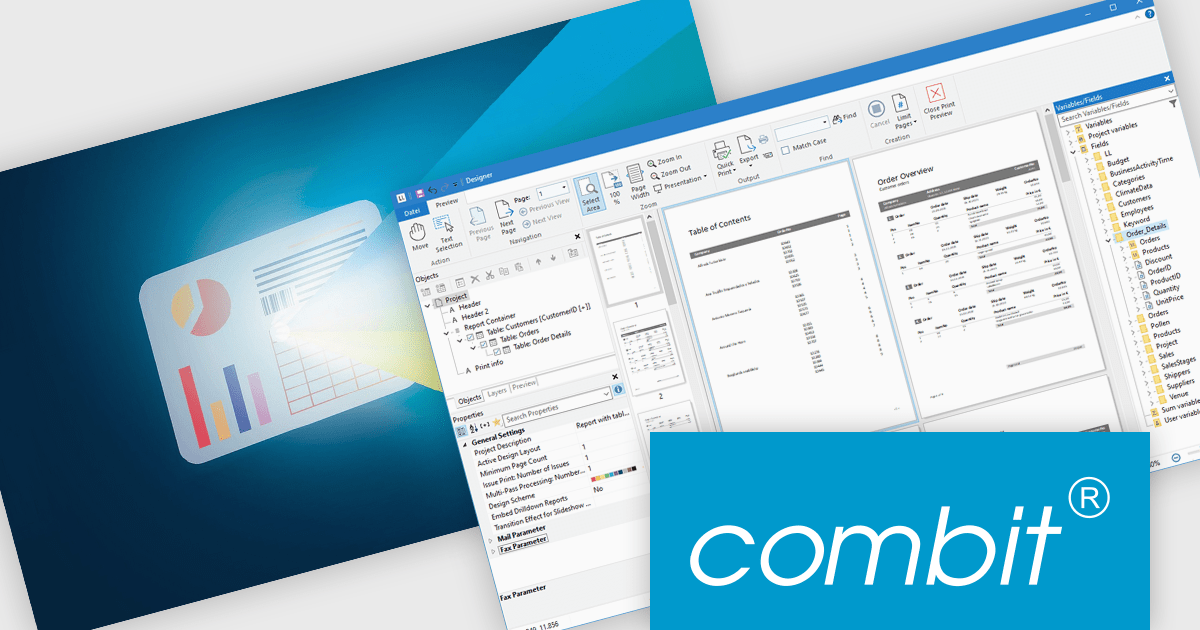
List & Label by combit is a software development toolkit that empowers developers to integrate comprehensive reporting functionalities into their desktop, web, and cloud applications. It offers features such as data binding, complex data visualization, and a user-friendly report designer, along with printing, exporting, and previewing capabilities. List & Label operates independently of programming languages and data sources, providing developers with the flexibility to design and deliver informative reports within their development environment.
The List & Label 31 update introduces cross-platform reporting, enabling developers to design, generate, and distribute reports across Windows, macOS, Linux, and web environments. This enhancement ensures consistent performance, layout accuracy, and data representation on every platform while reducing the need for multiple platform-specific implementations. By unifying the reporting process within a single framework, developers can deliver a cohesive reporting experience to all users, regardless of their operating system.
To see a full list of what's new in version 31, see our release notes.
List & Label is licensed per developer and is available as a Perpetual License with a 12 month support and maintenance subscription. See our List & Label licensing page for full details.
For more information, visit our List & Label Enterprise Reporting Edition product page.
전화 : 00798 14 800 6332
팩스 : +1 770 250 6199


