.NET 9 Blazor 뉴스

스크롤하는 동안 그리드 머리글 표시를 유지하세요

6월 12, 2025
세로 방향으로 스크롤할 때 그리드 상단의 머리글 행이 계속 표시되도록 고정시키면 대규모 데이터 세트에서 그리드 열의 컨텍스트를 유지할 수 있습니다.

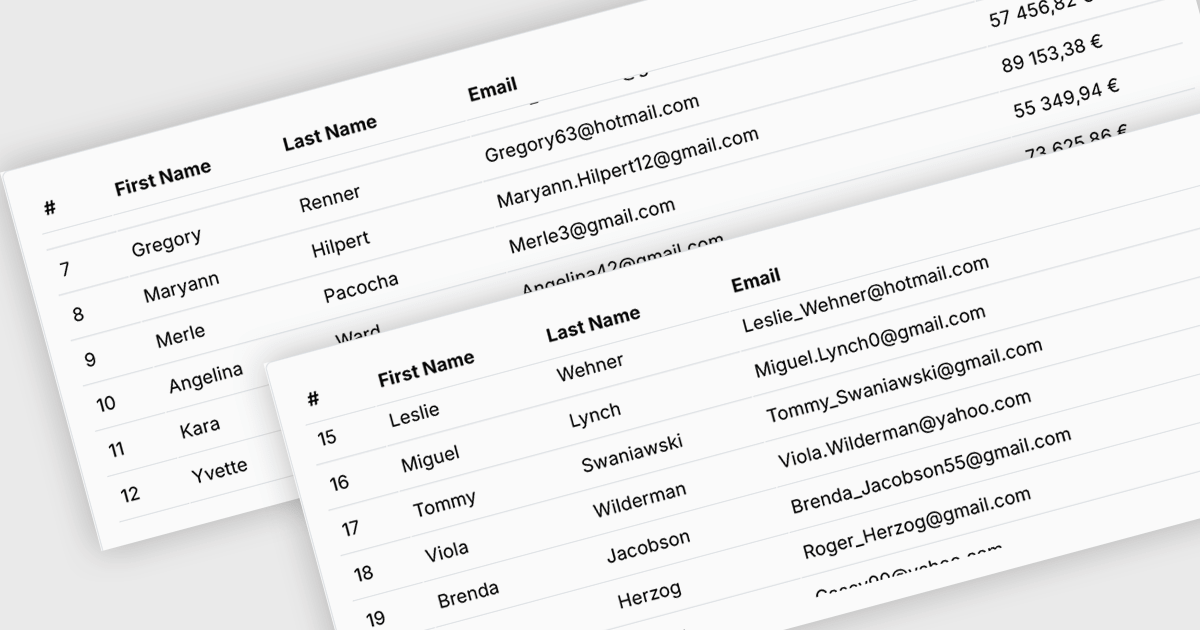
Fixed headers in a grid component refer to the user interface feature where the header row (or rows) of the grid remains visible at the top of the viewport while the user scrolls through the content vertically. This functionality is particularly useful in data-intensive applications, as it ensures that column labels stay in view, maintaining context and readability even with large datasets. For software developers, implementing fixed headers improves usability, enhances data navigation, and supports better comprehension by eliminating the need to repeatedly scroll back to the top to interpret column values.

Several Blazor Grids offer support for fixed headers including:

  • Telerik UI for Blazor Grid (part of Telerik UI for Blazor) lets you freeze header rows, enabling persistent column visibility during vertical scrolling in complex datasets.
  • Blazorise DataGrid (part of Blazorise) allows you to fix grid headers in place, preserving access to column labels while users navigate long data tables.
  • Syncfusion Blazor DataGrid (part of Syncfusion Essential Studio Enterprise) facilitates fixed headers that stay visible on scroll, ensuring uninterrupted context when viewing content.

For an in-depth analysis of features and price, visit our Blazor Grids comparison.

Compare Blazor Grids

직관적인 레이아웃을 쉽게 설계하고 빌드하세요

6월 11, 2025
정교한 레이아웃 내에서 UI 컨트롤을 효율적으로 구성하여 애플리케이션 전반에서 시각적 명확성과 일관된 기능을 모두 보장할 수 있습니다.

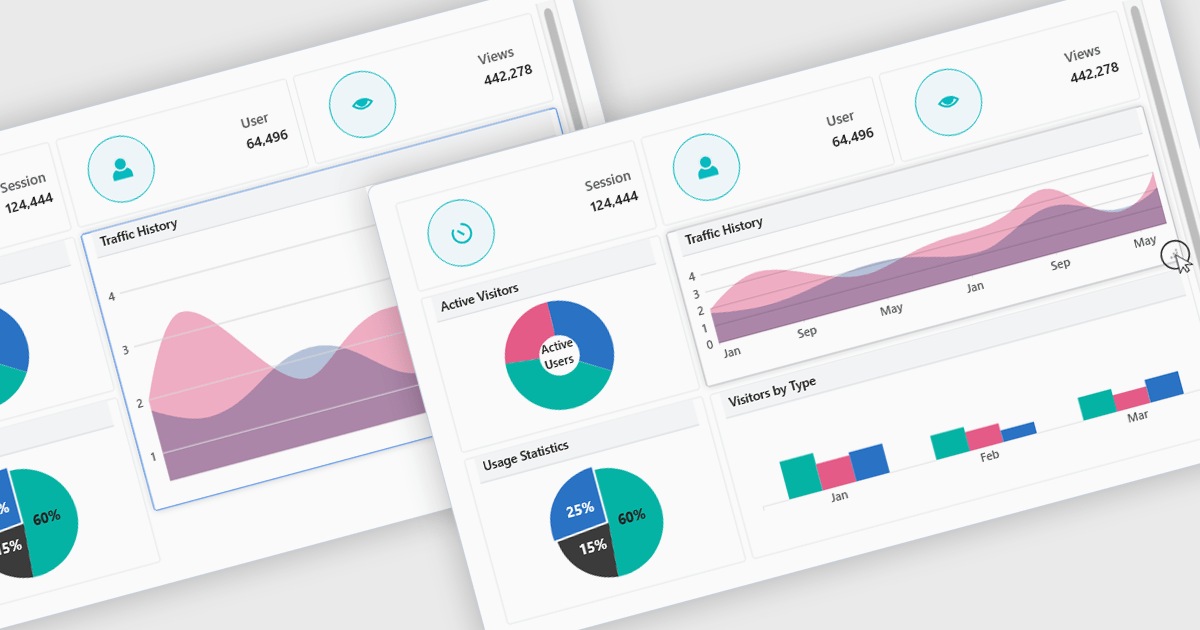
In a UI suite, layout refers to the arrangement and alignment of interface elements, such as widgets, charts, controls, and navigation bars, into a coherent structure that prioritizes usability and visual hierarchy. Effective layouts ensure that users can intuitively find and interact with content, while developers benefit from built-in support for responsive grids, flexible spacing, and adaptive positioning that simplifies the creation of consistent interfaces across devices.

Several .NET Blazor UI suites offer layout components including:

  • Blazorise allows you to implement flexible grid-based container layouts with responsive breakpoints, spacing utilities, and adaptive components for web applications.
  • Infragistics Ignite UI lets you create advanced dashboard-style layouts using responsive grid stacks, docking panels, and resizing for data-rich displays.
  • Telerik UI for Blazor facilitates composable layouts with grids, splitters, and adaptive stacking, ensuring responsive interfaces without extra markup.
  • DevExpress ASP.NET and Blazor allow developers to assemble layouts with splitters, docks, and fluid panels, delivering responsive, customizable user interfaces.

For an in-depth analysis of features and price, visit our .NET Blazor UI suites comparison.

Compare .NET Blazor UI Suites

사용자가 미리 정해진 목록에서 항목을 선택하도록 지원하세요

6월 10, 2025
Listbox는 내장된 필터링 및 맞춤형 템플릿을 컴팩트한 인터페이스 내에서 제공하므로, 눈길을 사로잡는 시각적인 방식으로 데이터를 선택하고 관리할 수 있습니다.

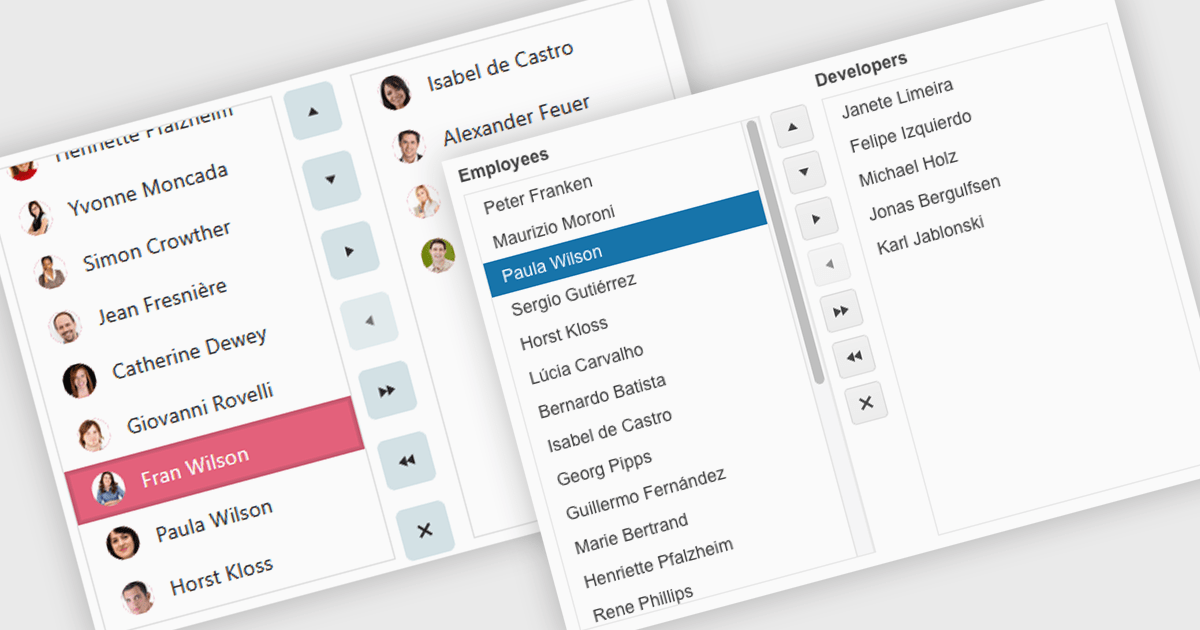
Listboxes are interactive controls that present users with a scrollable list of predefined options, allowing single or multiple selections without manual entry. By constraining inputs to valid choices and offering keyboard navigation, real-time filtering, and drag-and-drop reordering, they reduce errors and help maintain data integrity. Additionally, customizable templates let developers incorporate icons, colors, or detailed item descriptions, making complex data sets easier to scan. Overall, listboxes offer a compact, intuitive interface that balances flexibility with consistency, boosting productivity wherever structured data selection is needed.

Several .NET Blazor data editor collections can provide you with a listbox including:

  • IntegralUI for Blazor Data Editors (part of IntegralUI for Blazor by Lidor Systems) lets you integrate listboxes with filtering, keyboard navigation, and customizable templates.
  • jQWidgets Blazor Data Editors (part of jQWidgets)allows you to implement listboxes featuring virtual scrolling and responsive data binding.
  • ComponentOne Studio Blazor Edition (part of ComponentOne Studio Blazor Edition by MESCIUS) facilitates building listboxes with filtering, selection events and theming.
  • DevExpress Blazor Data Editors (part of DevExpress ASP.NET and Blazor) lets you incorporate listboxes with search filtering and selection checkboxes.

For an in-depth analysis of features and price, visit our .NET Blazor data editors comparison.

Compare .NET Blazor Data Editors

다양한 소스에서 데이터를 검색하고 표시하세요

6월 9, 2025
MongoDB, XML, JSON, Excel과 같은 다양한 데이터 소스를 기본으로 지원하므로, 보고서에 실시간 정보를 쉽게 바인딩하고 시각화할 수 있습니다.

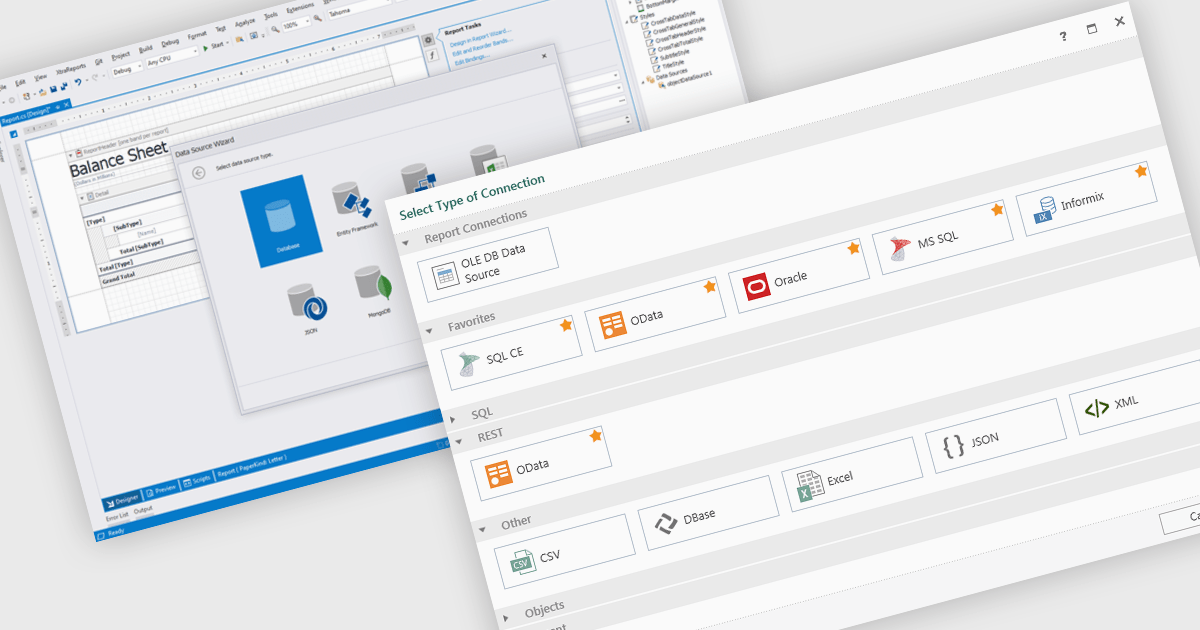
Data connectivity is a foundational aspect of modern reporting components, enabling applications to retrieve and present data from a wide variety of sources. Whether integrating with relational databases, cloud services, or flat files, effective data connectivity ensures that reports reflect current, accurate information. Reporting components are designed to abstract the complexity of accessing these data sources, providing developers with flexible APIs and tools to bind data into visualizations and formatted reports.

Common features include:

  • Entity Framework ORM integration simplifies data access by enabling reporting on strongly-typed entities directly from the application's data model.
  • Excel / CSV support is essential for importing user-generated data or integrating with business workflows where spreadsheets are common.
  • IEnumerable provides broader compatibility with LINQ and deferred execution, enabling more dynamic and efficient data querying.
  • IList support allows reporting tools to bind directly to .NET collections, making it easy to create reports from in-memory objects.
  • JSON data binding supports modern web APIs and microservices, allowing developers to build reports from real-time or external data feeds formatted in a lightweight, widely-used structure.
  • MongoDB integration enables reporting over NoSQL data structures, particularly useful for applications relying on flexible, document-oriented databases.
  • OLEDB connectivity facilitates access to legacy systems and a wide range of data providers through a standardized interface.
  • XML data sources are often used for structured data interchange and provide a versatile method for both hierarchical and flat data binding.

For an in-depth analysis of features and price, visit our Blazor reporting components comparison.

Explore Blazor Data Connectivity Features

꺾은선형 차트를 통해 시간 경과에 따른 추세를 시각화하세요

6월 6, 2025
꺾은선형 차트(line chart)는 지표의 변화를 시각적으로 보여주며, 이를 통해 여러 시리즈를 비교하고, 변화 추이를 파악하며, 전략적 예측을 수행할 수 있습니다.

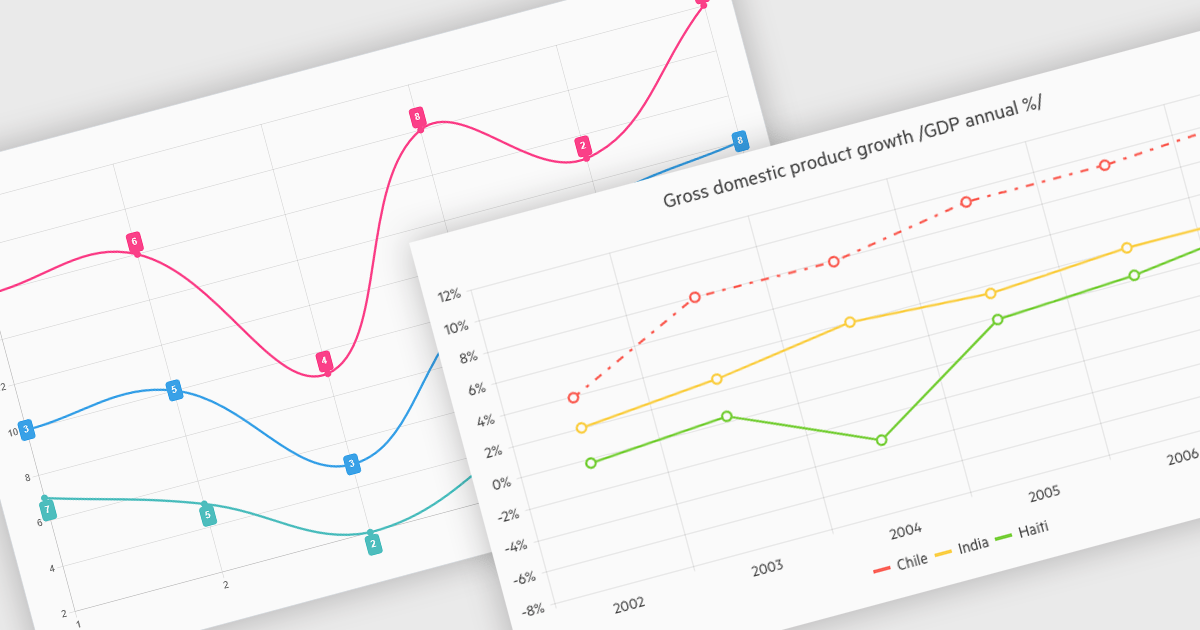
Line charts connect data points with lines to show how values change over a continuous scale, usually time. They make it easy to reveal long-term trends, seasonal patterns and sudden shifts while comparing multiple series on the same axes. Common applications include tracking stock prices, monitoring website traffic, analyzing climate data and comparing regional sales to guide business strategy. By highlighting progression and anomalies without clutter, line charts help turn raw numbers into clear, actionable insights.

Several .NET Blazor Chart Controls offer support for line charts including:

  • Blazorise Chart lets you create customizable line charts with smooth animations, tooltips, zooming, and responsive layouts for high-performance real-time apps.
  • TeeChart Blazor by Steema Software allows you to render high-performance line charts with multiple series, styling, interactive panning and zoom controls, export functionality.
  • Infragistics Blazor Charts (part of Infragistics Ignite UI) facilitates responsive line chart creation with styling, axis customization, real-time updates, data markers and tooltips.
  • DevExpress Blazor Chart (part of DevExpress ASP.NET and Blazor) enables developers to build interactive line charts featuring zooming and customizable legends.

For an in-depth analysis of features and price, visit our comparison of .NET Blazor Chart Controls.

Compare .NET Blazor Chart Controls