


공식 공급 업체
200 이상의 소프트웨어 개발처와 판매 계약을 맺은 공인 디스트리뷰터로서 합법적인 라이선스를 제공합니다.
모든 브랜드 보기.
ImageGear for .NET by Accusoft is a development toolkit that empowers you to add robust image processing and document handling functionalities to your .NET applications. It provides comprehensive support for a wide range of file formats, including common image types, PDFs, DICOM medical images, and even Microsoft Office files. ImageGear offers functionalities such as conversion, editing, annotation, viewing, and OCR, streamlining your development process for document-centric applications.
The ImageGear for .NET v26.4.0 update streamlines PDF archiving with the introduction of a RESTful PDF to PDF/A Converter API. This API empowers your applications to seamlessly convert any PDF document into a fully PDF/A compliant archive format. This ensures long-term accessibility and fidelity of your documents, meeting industry standards for preservation.
To see a full list of what's new in v26.4.0, see our release notes.
ImageGear for .NET is licensed per developer and is available as an annual license with 12 months support and upgrades. See our ImageGear for .NET licensing page for full details.
For more information, see our ImageGear for .NET product page.
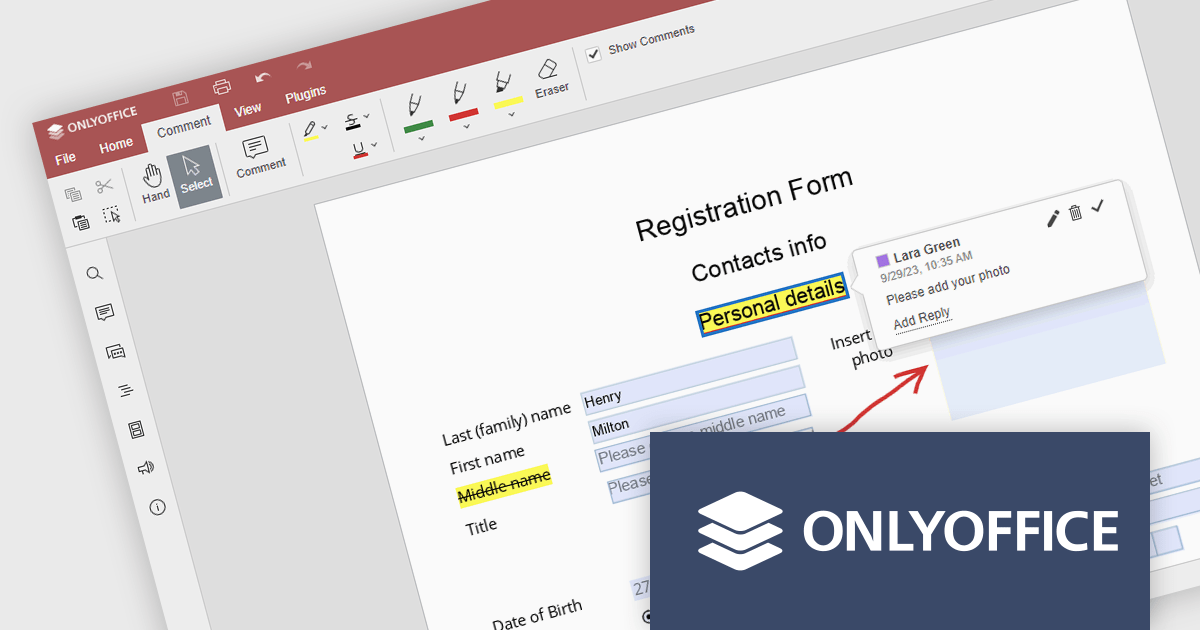
ONLYOFFICE Docs Enterprise Edition with WordPress Connector combines an online document editor with a seamless integration for WordPress, which is a content management system for creating and managing websites. This allows teams to create, view, edit, and collaborate on spreadsheets, presentations, and text files online, directly within WordPress, boosting efficiency and eliminating the need for file switching.
The ONLYOFFICE WordPress Connector 2.0.0 release (available as part of ONLYOFFICE Docs Enterprise Edition with WordPress Connector v8.0.1) brings the ability to open PDF files uploaded to your WordPress site directly within the admin dashboard for form filling and annotating using ONLYOFFICE Docs. You can fill out interactive fields, highlight, underline and strikethrough text, leave comments, and draw different objects and lines with the built-in drawing tools. By enabling seamless interactions with PDF documents directly within the platform and reducing the steps needed to edit or comment on PDF files, this capability streamlines document management workflows, optimizes productivity and eliminates the need for external software solutions.
To see a full list of what's new in ONLYOFFICE Docs Enterprise Edition v8.0.1 with WordPress Connector 2.0.0, see our release notes.
ONLYOFFICE Docs Enterprise Edition with WordPress Connector is licensed per server and is available as an annual license with 1 year of support and updates, or as a perpetual license with 3 years of support and updates. See our ONLYOFFICE WordPress connector licensing page for full details.
For more information, see our ONLYOFFICE WordPress connector product page.
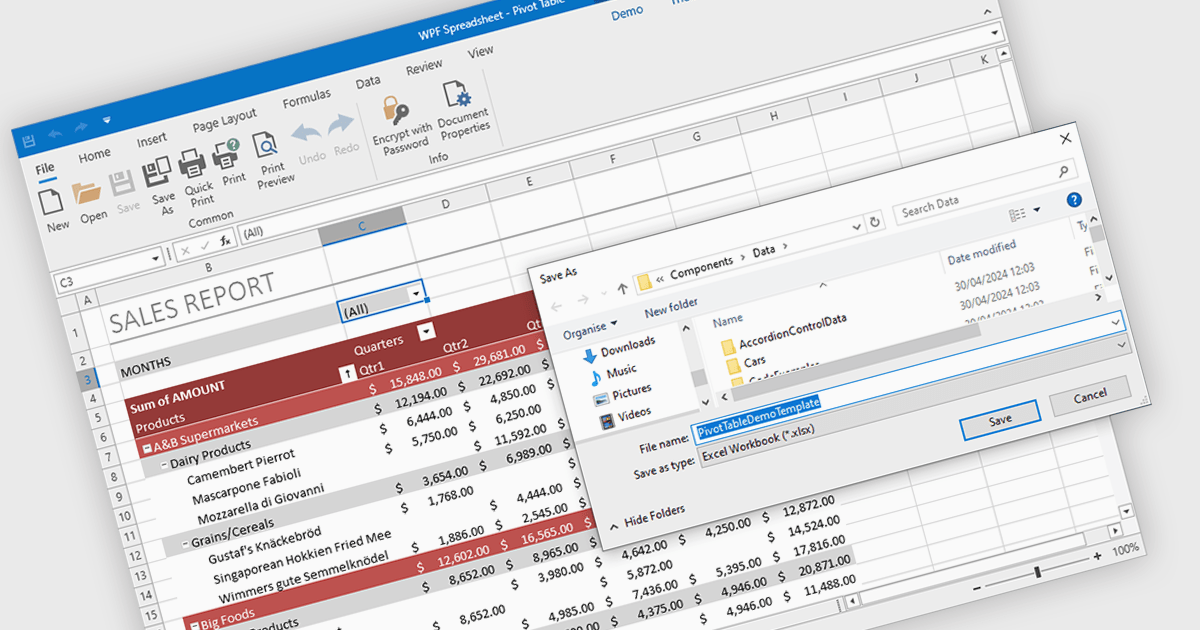
Spreadsheet components with XLSX export functionality allow developers to seamlessly save spreadsheet data and formatting from their application as a Microsoft Excel compatible file. This functionality provides significant benefits such as increased data portability for users who can then open and edit the spreadsheets in Excel, and improved collaboration as data can be easily shared and worked on across different platforms.
Several WPF spreadsheet controls offer the ability to export XLSX files including:
For an in-depth analysis of features and price, visit our WPF spreadsheet controls comparison.
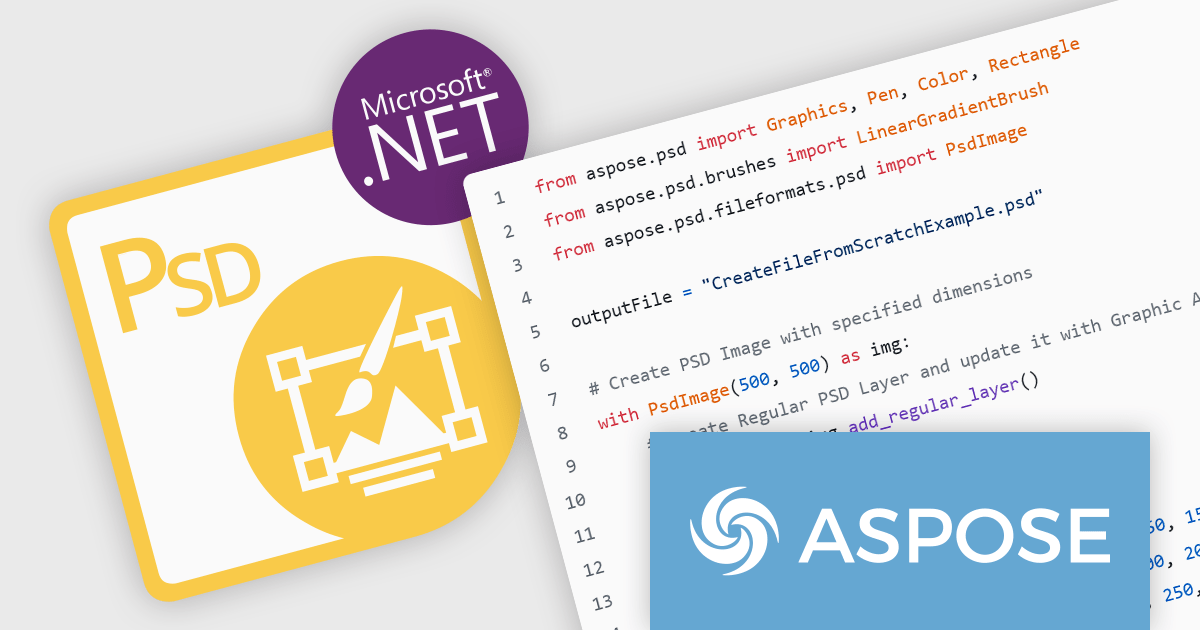
Aspose.PSD for Python via .NET fills a critical gap for Python developers. It provides a powerful library that leverages the .NET framework to work with PSD, PSB, and AI files. This eliminates the need for external software like Adobe Photoshop or Illustrator, allowing Python programmers to create, edit, and convert these image formats directly within their code.
Aspose.PSD provides a comprehensive toolkit for developers, enabling them to manage layers within Photoshop (PSD) files, edit embedded text, apply artistic effects through blending modes and filters, and even convert these images to common formats like PNG, JPEG, and PDF. This versatility makes Aspose.PSD a valuable asset for applications in graphic design, web development with image manipulation needs, and automating tasks within creative workflows.
Aspose.PSD for Python via .NET is offered as Developer Small Business, Developer OEM, Site Small Business, and Site OEM licenses catering to a range of business needs. Licenses are perpetual, and include 1 year of support and maintenance. Subscription renewals are also available. See our Aspose.PSD for Python via .NET licensing page for full details.
Aspose.PSD for Python via .NET is available in the following products:
The DevExpress Office File API enables developers to read and write Excel and Word files, create PDF documents, and generate barcodes and compressed archives. It can be used to convert documents to a different format, password-protect documents, and digitally sign Office documents and PDFs.
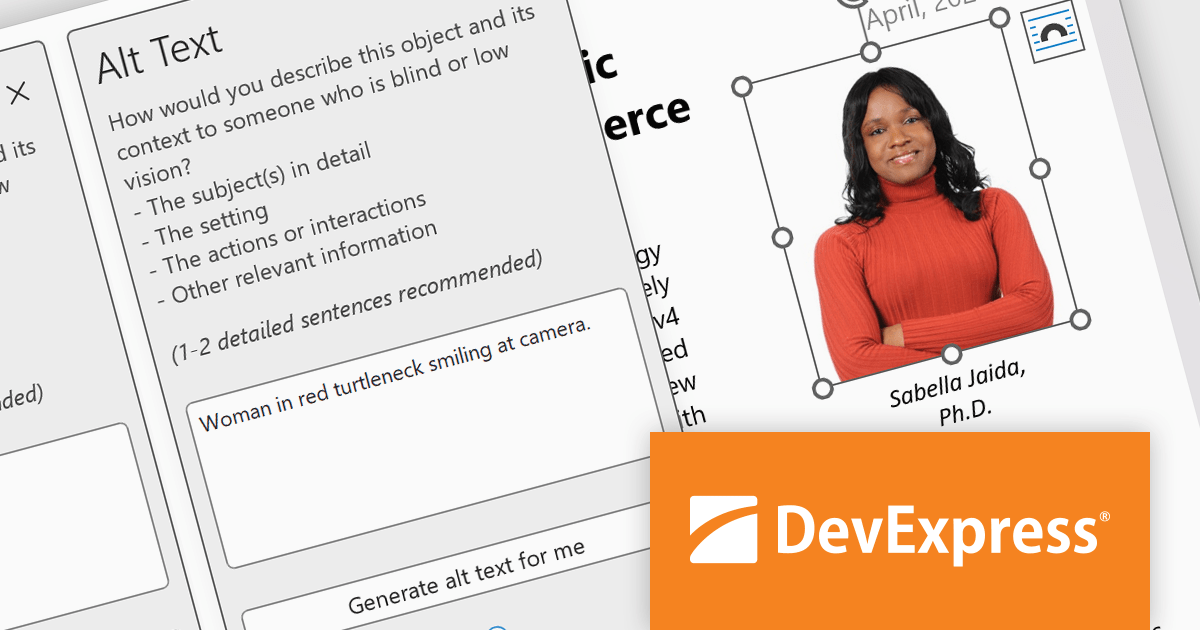
In this blog post, DevExpress Technical Writer Poline Fedorova shows you how to integrate the OpenAI model into a DevExpress-powered Office API application and add missing media descriptions and alt text into Word and Excel files which can then be exported to PDF and read with a screen reader. Sample code is included for each step and you can even download the entire project from GitHub.
Read the full blog to get started using OpenAI along with DevExpress Office File API to enhance the accessibility features of your Word, Excel, and PDF documents.
DevExpress Office File API is licensed per developer and is available as a Perpetual License with a 12 month support and maintenance subscription. See our DevExpress Office File API licensing page for full details.
DevExpress Office File API is available to buy in the following products:
전화 : 00798 14 800 6332
팩스 : +1 770 250 6199


