.NET 뉴스

리본 막대를 통한 WPF 앱 향상

7월 4, 2023
사용자에게 리본 메뉴가 있는 현대적이고 사용자 친화적인 사용자 인터페이스를 제공합니다.

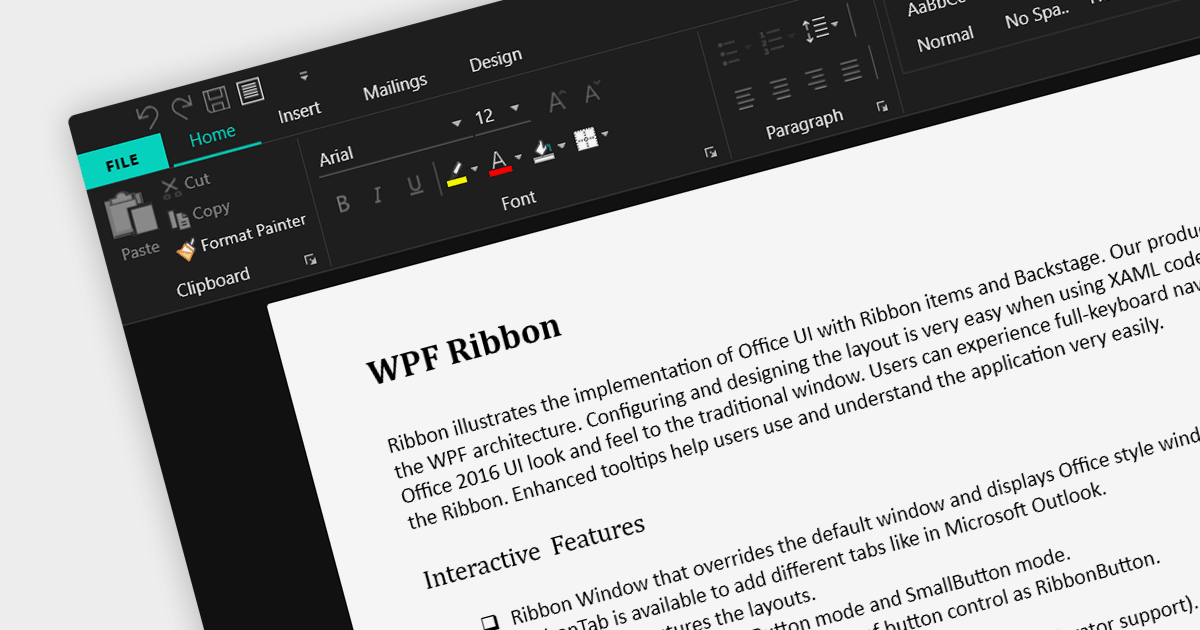
A ribbon control is a graphical user interface element that consists of a horizontal strip displaying various commands and functions organized into tabs and groups for easy access and navigation. Ribbons are designed to be easy to use and understand. Tools are grouped together in a logical way, making it easy for users to find the commands they need, even if they are not familiar with the application.

Here are some example WPF UI suites that offer a ribbon control:

  • DevExpress WPF provides a comprehensive set of WPF controls, including a feature-rich Ribbon control for creating modern and efficient user interfaces. With its extensive customization options and built-in functionalities, it simplifies the development process and enhances the end-user experience.
  • Infragistics Ultimate UI for WPF offers a ribbon that comes with various design options, seamless integration with other controls, enabling developers to build interactive and visually appealing applications.
  • Telerik UI for WPF includes a versatile RibbonView control that enables developers to design intuitive and productive UIs. RibbonView integrates easily with other Telerik controls and provides a consistent look and feel across different platforms.
  • Actipro WPF Studio offers a highly customizable Ribbon control, empowering developers to craft professional-grade user interfaces. With extensive styling options and support for WPF features like commands and application menus, Actipro enables developers to build stunning ribbon-based applications.

For an in-depth analysis of features and price, visit our comparison of WPF UI suites.
Compare WPF UI Suites

.NET 차트 비교에 LightningChart 추가

6월 30, 2023
LightningChart의 기능을 다양한 .NET용 대체 차트와 비교하세요.

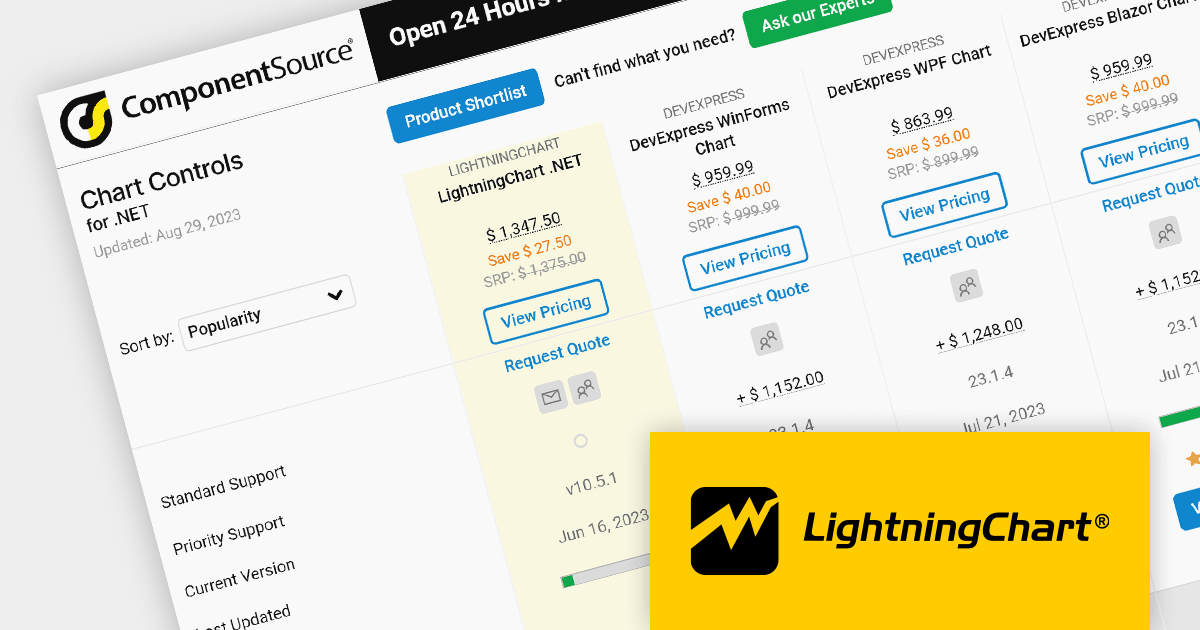
As the premier marketplace for software components and development tools, we are pleased to announce the addition of LightningChart by Arction Ltd to our .NET Charts Comparison. This latest inclusion further enriches the comparison tool's offerings, providing developers with a wider selection of high-performance charting components for their .NET projects.

LightningChart is renowned for its cutting-edge visualization capabilities, empowering developers to create stunning interactive charts, graphs, and dashboards with exceptional speed and responsiveness. With its extensive range of chart types, customization options, and real-time data streaming support, LightningChart offers flexibility and performance for data visualization in .NET applications.

Our updated .NET Charts Comparison enables developers to evaluate LightningChart with over 70 other popular charting components. It provides an in-depth analysis of each control's features, including supported chart types, data binding options, interactivity, styling, and .NET framework support, as well as pricing and community reviews. With extensive sorting and filtering options, our comparison makes it easy to shortlist products and find the best solutions for your specific needs.

By incorporating LightningChart into the comparison, we continue to ensure that developers have access to a comprehensive overview of the top charting components available in the market. This empowers developers to make informed decisions based on their specific requirements, ultimately saving time and effort in the selection process.

For an in-depth analysis of features and price, visit our comparison of .NET 7 charts.
Compare .NET Charts

.NET 7 WinForms를 사용하여 ComboBox 데이터 유효성 검사

6월 21, 2023
정확하고 일관된 데이터 입력을 보장하고 콤보박스 유효성 검사에 대한 사용자의 불만을 줄입니다.

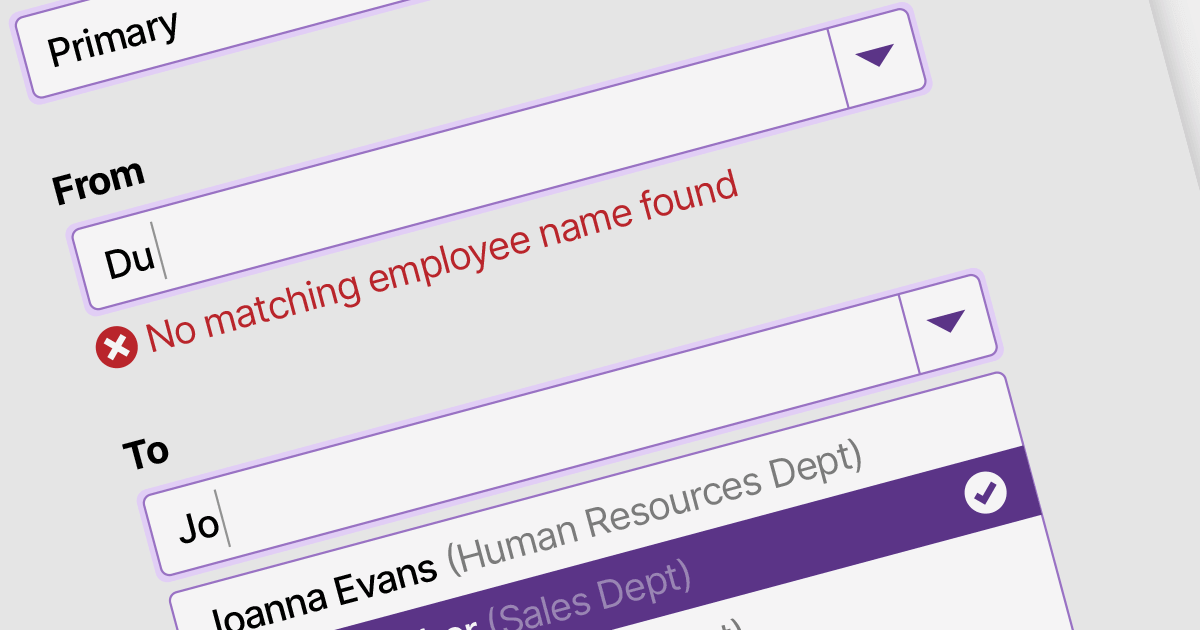
Data validation in ComboBox controls ensures the selected value meets specific criteria or constraints. It involves validating user input against predefined rules such as required selection, range checks, or custom validation logic. By validating the data, ComboBox editors help maintain data integrity and enhance the accuracy and reliability of user input.

Here are some examples of .NET 7 WinForms data editors collections that support data validation in combo boxes:

  • DevExpress WinForms Data Editors (part of DevExpress WinForms) provides ComboBox editors with built-in data validation capabilities, including required field validation, range checks, and custom validation logic.
  • Infragistics Ultimate UI for Windows Data Editors (part of Infragistics Ultimate UI for Windows Forms) offers ComboBox editors that support data validation, allowing developers to enforce rules and constraints on user input.
  • ComponentOne WinForms Input and Editors (part of ComponentOne Studio WinForms by GrapeCity) includes ComboBox editors with validation features, enabling developers to validate selected values based on specified criteria.
  • Telerik UI for WinForms Data Editors (part of Telerik UI for WinForms) contains ComboBox editors with comprehensive data validation options, allowing developers to validate user selections against defined rules.

For an in-depth analysis of features and price, visit our comparison of .NET 7 WinForms data editors.
Compare .NET 7 Winforms Data Editors

WPF를 사용하여 보고서에 Sparklines 추가

6월 19, 2023
WPF 보고서의 셀 내에 마이크로 차트를 추가하여 데이터 추세를 강조 표시합니다.

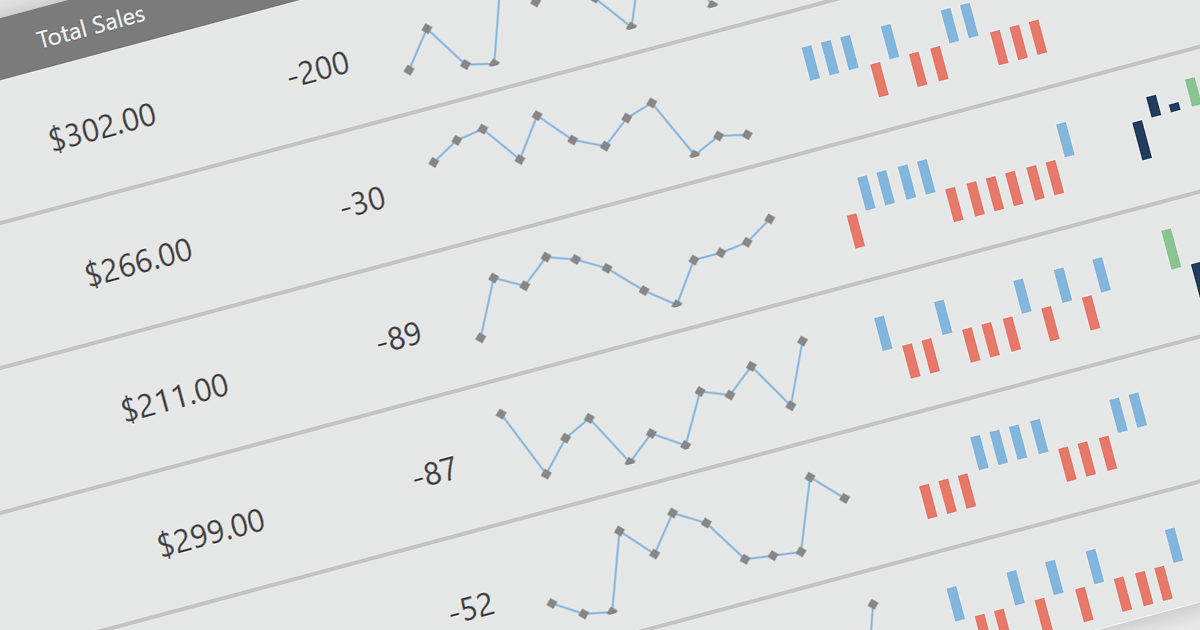
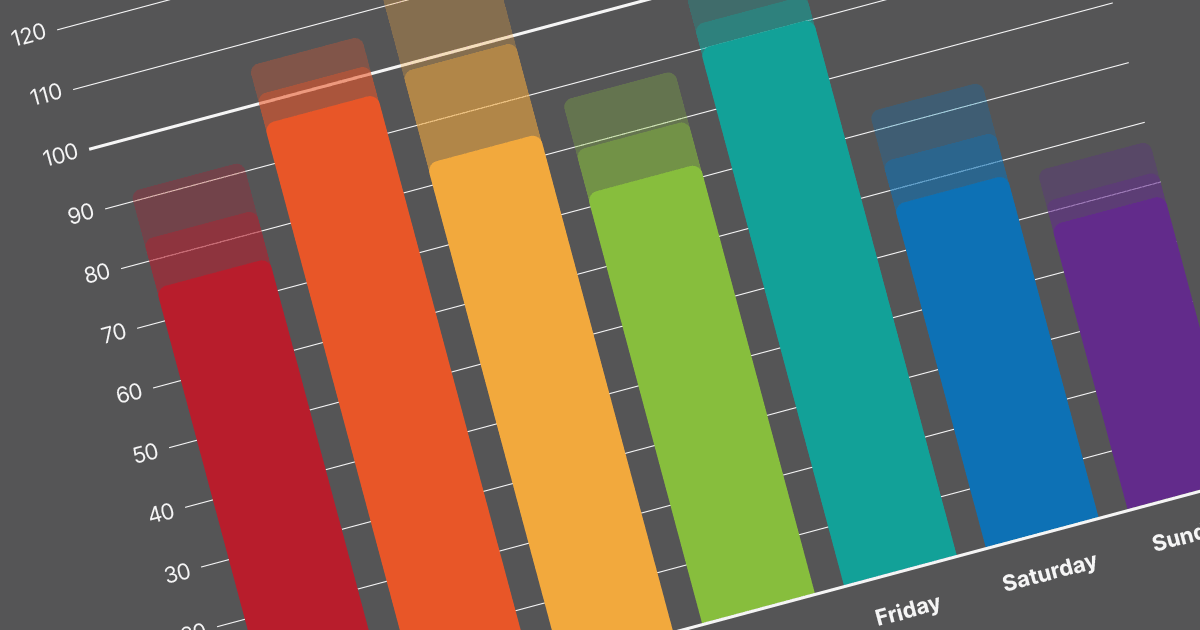
Sparklines are miniature line graphs designed to provide a visual representation of data trends within a compact space. They condense information into a single line or bar, often displayed alongside text or numbers. They allow for quick and intuitive understanding of patterns, making them useful for displaying data in tight spaces such as data tables, and providing visual summaries at a glance.

The following WPF reporting controls include support for sparklines:

  • DevExpress Reports (Multi-Platform) (part of DevExpress Reporting) is a versatile solution with sparkline support that allows developers to build visually appealing reports in WPF applications.
  • ActiveReports.NET by MESCIUS (formerly GrapeCity) offers a range of flexible and customizable controls, allowing developers to integrate sparklines seamlessly into their reports and deliver engaging data visualizations.
  • List & Label Enterprise Reporting Edition by combit provides a wide selection of reporting features including sparklines, empowering developers to create interactive and visually informative reports with ease.
  • Stimulsoft Reports.Wpf has an intuitive design environment which helps developers design reports with sparklines to effectively convey insights to end users.

For an in-depth analysis of features and price, visit our comparison of WPF reporting controls.
Compare WPF Report Controls

.NET 7 WinForms를 이용한 차트 애니메이션

6월 8, 2023
시선을 사로잡는 애니메이션으로 데이터 시각화에 생기를 불어넣으세요.

Animation in charts can be used to improve the readability, comprehension and engagement of data visualizations. By incorporating animation in charts you can draw attention to specific points and trends, helping your audience better understand the information being conveyed.

Several WinForms charting components offer animation support, including:

  • TeeChart WinForms provides animation capabilities, allowing developers to create visually captivating charts with smooth transitions and effects.
  • .net Charting offers animation support, enabling WinForms developers to add engaging, interactive charts to their applications.

Alternatively, there are several suites which contain charting components that support chart animation:

  • DevExpress WinForms Chart (part of DevExpress WinForms) provides a comprehensive charting solution with built-in animation support, allowing for smooth transitions and effects during data updates and interactions.
  • Telerik Windows Forms ChartView (part of Telerik UI for WinForms) offers animation capabilities, enabling developers to create engaging and interactive charts with seamless transitions.
  • Syncfusion WinForms Chart (part of Syncfusion Essential Studio for WinForms) includes animation support, allowing developers to create visually appealing charts with fluid animations.
  • Infragistics Windows Forms Charts (part of Infragistics Ultimate UI for WinForms) offers a powerful charting toolkit with animation features, providing developers with the ability to create dynamic and captivating visualizations.

For an in-depth analysis of features and price, visit our comparison of .NET 7 WinForms charts.

Compare .NET 7 WinForms Charts