


공식 공급 업체
200 이상의 소프트웨어 개발처와 판매 계약을 맺은 공인 디스트리뷰터로서 합법적인 라이선스를 제공합니다.
모든 브랜드 보기.

Data connectivity options allow reporting components to integrate with various data sources to retrieve, process, and display data in reports. It typically involves connecting to databases, APIs, web services, or in-memory data structures to fetch real-time or static data. This connectivity is often achieved through frameworks, libraries, or built-in support for data binding and querying mechanisms, such as RESTful APIs, GraphQL, or direct database connections via server-side proxies. Reliable data connectivity enables reporting components to efficiently manage large datasets, perform transformations, and dynamically refresh reports, delivering interactive and precise insights to end-users.
JavaScript reporting components support various data connections including:

Sparkline charts are compact, data-rich visuals that display trends, patterns, and variations in a minimalistic format. Unlike traditional charts, they save space and seamlessly integrate into tables, dashboards, or reports for quick insights. These charts are particularly useful for identifying trends over time, monitoring real-time changes, and enhancing data readability. Common use cases include financial reports to track stock performance, sales dashboards to visualize revenue fluctuations, and performance monitoring tools to highlight system metrics. With their ability to quickly convey key insights in a visually intuitive manner, sparkline charts are an essential tool for data-driven decision-making.
Several React charts offer sparkline chart support, including:
For an in-depth analysis of features and price, visit our React chart comparison.
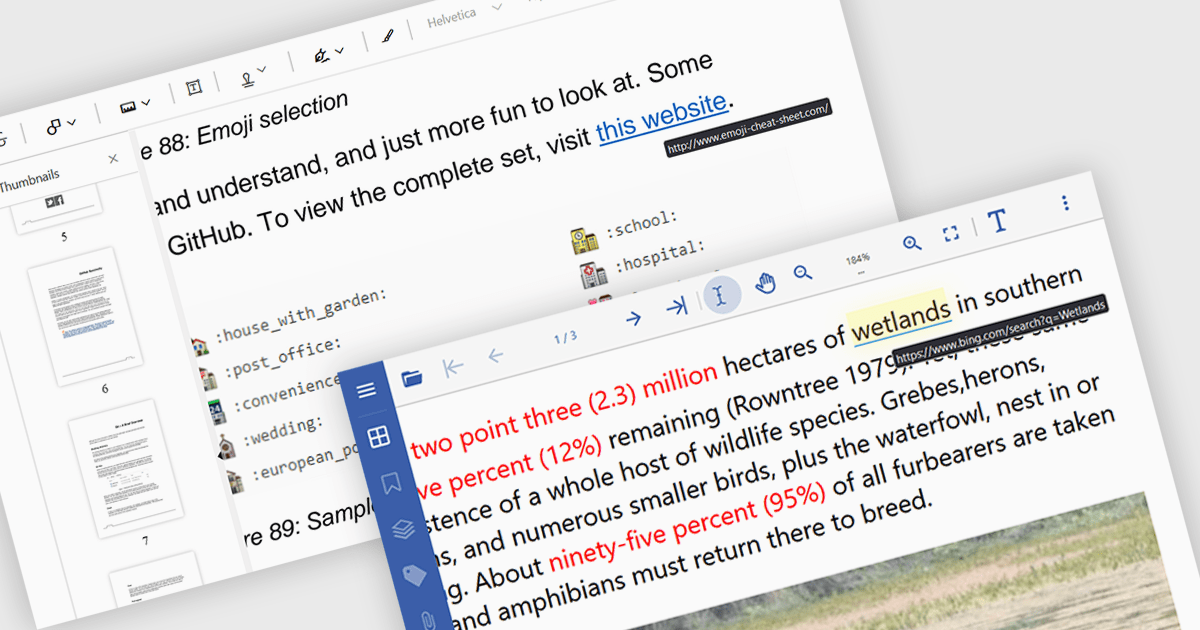
Hyperlink navigation support in a PDF Viewer enables users to seamlessly navigate within and between PDF documents by clicking on embedded hyperlinks. This functionality enhances user experience by facilitating quick access to relevant information, improving document organization and accessibility, and streamlining workflows that involve interacting with multiple linked documents.
Several React PDF viewers support hyperlink navigation including:
For an in-depth analysis of features and price, visit our comparison of React PDF viewers.

ONLYOFFICE Docs Enterprise Edition with Alfresco Connector combines an online document editor with a seamless integration for Alfresco Share, which is a content management platform that allows users to store, organize, and collaborate on documents and other digital assets. This integration allows teams to create, view, edit, and collaborate on spreadsheets, presentations, and text files online, directly within Alfresco Share using ONLYOFFICE editors, boosting efficiency and eliminating the need for file switching.
The ONLYOFFICE Connector for Alfresco v8.0 update introduces interactive PDF forms, enabling developers to create structured, fillable documents directly within Alfresco. This enhancement streamlines data collection and document automation by allowing users to add text fields, dropdowns, checkboxes, signature fields, and other interactive elements without requiring external tools. With native support for digital signatures and standardized input fields, the update improves workflow efficiency, reduces manual data entry, and ensures seamless integration into existing document management processes.
To see a full list of what's new in ONLYOFFICE Docs Enterprise Edition v8.2.2 with Alfresco Connector 8.0, see our release notes.
ONLYOFFICE Docs Enterprise Edition with Alfresco Connector is licensed per server as an annual license with 1 year of support and updates, or as a perpetual license with 3 years of support and updates. See our ONLYOFFICE Alfresco connector licensing page for full details.
For more information, see our ONLYOFFICE Alfresco connector product page.
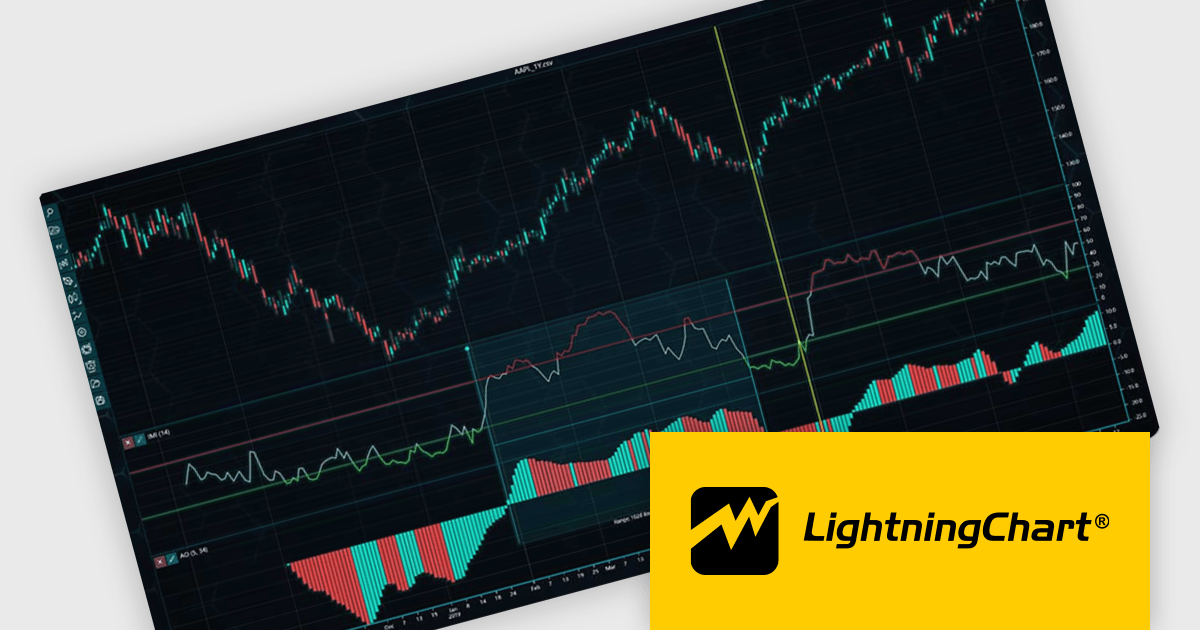
LightningChart JS Trader is a JavaScript/TypeScript library developed by LightningChart that specifically targets the creation of financial and trading applications. It provides high-performance, 2D, 3D, and real-time charting controls and a comprehensive suite of visualizations including candlestick, bar, line, and various technical indicators and drawing tools. This library enables software developers to craft interactive technical analysis tools without the need for server-side setup as it runs completely on the client device.
The LightningChart JS Trader v3 update introduces draggable splitter lines, enabling users to dynamically resize indicator segments and the main chart within a single view. This enhancement provides greater flexibility in data visualization, allowing developers to create a more customizable and user-friendly charting experience. By adjusting the layout interactively, users can allocate space efficiently based on analytical needs, improving readability and workflow efficiency. This update eliminates the need for separate charts, streamlining technical analysis and ensuring all relevant data remains accessible within a unified interface.
To see a full list of what's new in v3, see our release notes.
LightningChart JS Trader is licensed per developer and is available as an annual license with 1 year support. See our LightningChart JS Trader licensing page for full details.
For more information, see our LightningChart JS Trader product page.
전화 : 00798 14 800 6332
팩스 : +1 770 250 6199


