


공식 공급 업체
200 이상의 소프트웨어 개발처와 판매 계약을 맺은 공인 디스트리뷰터로서 합법적인 라이선스를 제공합니다.
모든 브랜드 보기.
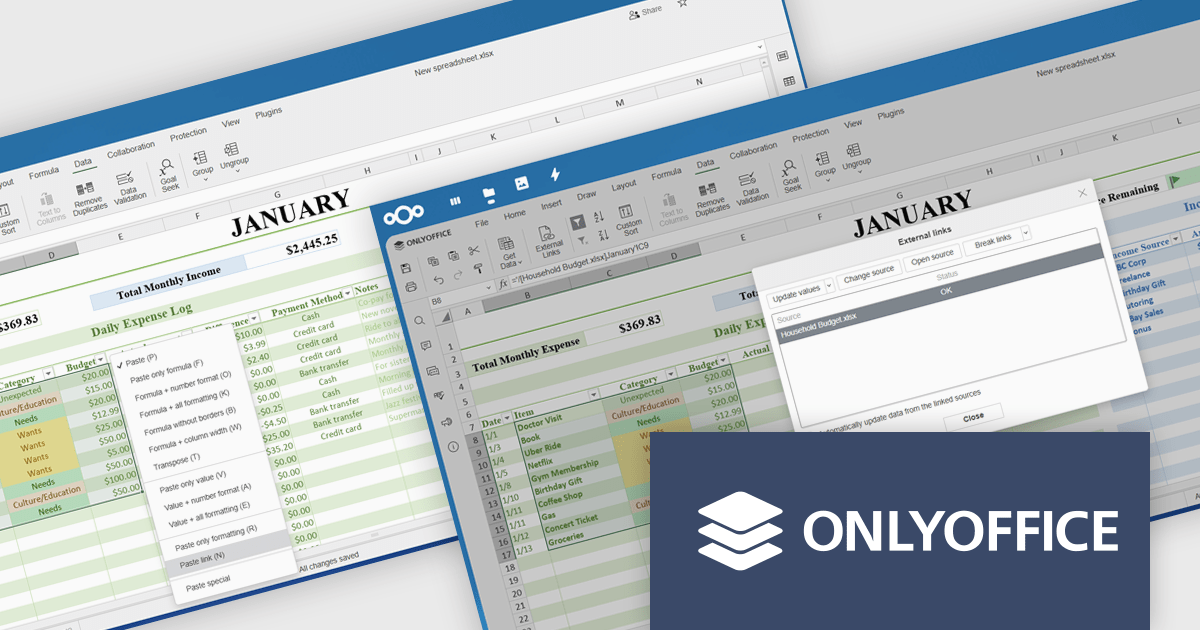
ONLYOFFICE Docs Enterprise Edition integrates seamlessly with both ownCloud and Nextcloud connectors, combining a powerful online document editor with two leading on-premises content collaboration platforms. This integration allows teams to create, view, edit, and collaborate on spreadsheets, presentations, and text documents in real time, directly within their ownCloud or Nextcloud environments, boosting productivity and eliminating the need to switch between applications.
The latest updates for the ONLYOFFICE Nextcloud and ownCloud connectors (9.9.0 and 9.9.1 respectively) introduce support for importing reference data into spreadsheets using external links, allowing developers to dynamically integrate data from third-party sources directly into their ONLYOFFICE spreadsheets. This enhancement simplifies cross-document referencing by enabling users to pull specific cell ranges from external files, reducing manual data handling and improving consistency across documents. It also supports automatic data updates and source management, helping developers maintain accurate, synchronized datasets within collaborative environments hosted on Nextcloud or ownCloud.
To see a full list of what's new, see our release notes for ONLYOFFICE Nextcloud Connector v9.9.0 and ONLYOFFICE ownCloud Connector v9.9.1.
The ONLYOFFICE Nextcloud and ownCloud connectors are both licensed per server and are available as an annual license with 1 year of support and updates, or as a perpetual license with 3 years of support and updates. See our licensing pages for the Nextcloud and ownCloud connectors for full details.
For more information, see our product pages:
Telerik Reporting and Telerik Report Server deliver a complete solution for creating, managing, and distributing reports across .NET applications. Telerik Reporting is a lightweight, embedded reporting tool for .NET web and desktop apps. It lets developers and users easily design, customize, and export interactive, reusable reports. It supports multiple platforms, including ASP.NET Core, Blazor, MVC, AJAX, HTML5/JS, Angular, WPF, WinForms, and WinUI. Telerik Report Server is a web-based, server-side solution for centralized report management. Built on Telerik Reporting, it offers scheduling, delivery, user management, and web-based access. It can be used standalone or integrated into apps built with Blazor, Angular, or Windows Forms.
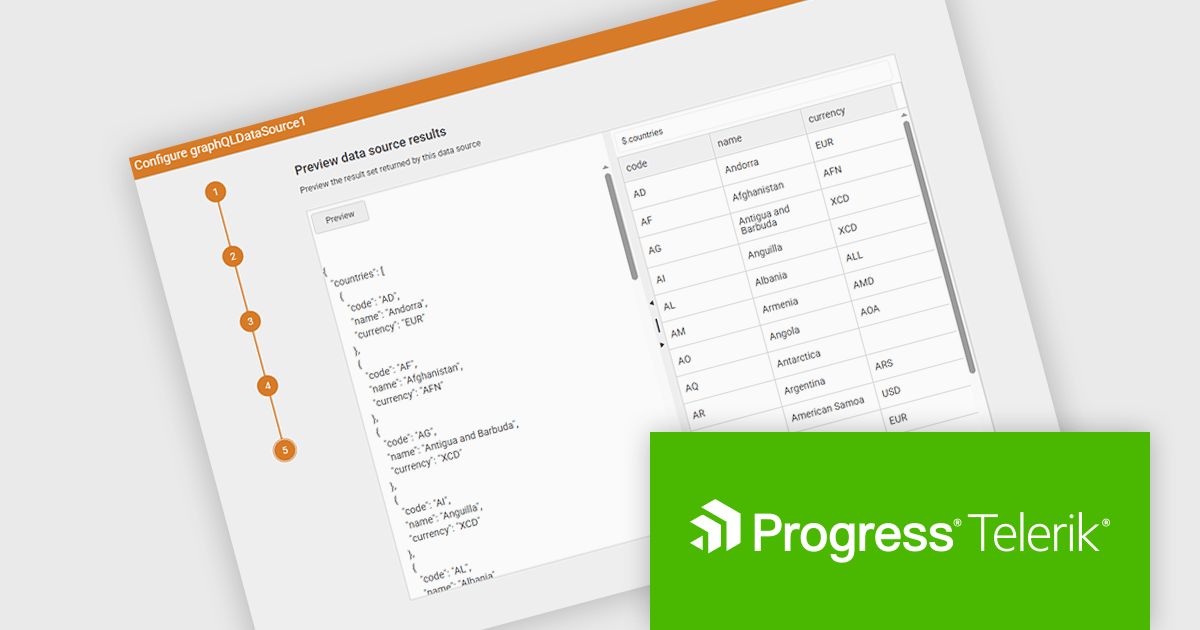
The Telerik Reporting and Telerik Report Server 2025 Q2 update introduces a new GraphQL DataSource Wizard in the Web Report Designer that simplifies the process of connecting to GraphQL APIs. This enhancement improves data integration by guiding developers through a clear, step-by-step configuration process, eliminating the need for manual setup or in-depth knowledge of GraphQL syntax. It enables faster data connectivity and report creation directly within the browser-based design environment, improving overall efficiency and reducing development time when working with GraphQL data sources.
To see a full list of what's new, see our release notes for Telerik Reporting and Telerik Report Server 2025 Q2.
Telerik Reporting is licensed per developer and has two licensing models: an annual Subscription License and a Perpetual License. The Subscription license must be renewed to continue using the software. The Perpetual license is a one-time purchase granting access to the current released version and includes a one-year subscription for product updates and technical support. Telerik Report Server is available as a perpetual license and is licensed per domain. Each domain license contains 15 Client Access Licenses and 1 year support and maintenance. See our licensing pages for Telerik Reporting and Telerik Report Server for full details.
Telerik Reporting and Telerik Report Server are available individually or as part of Telerik DevCraft Ultimate.
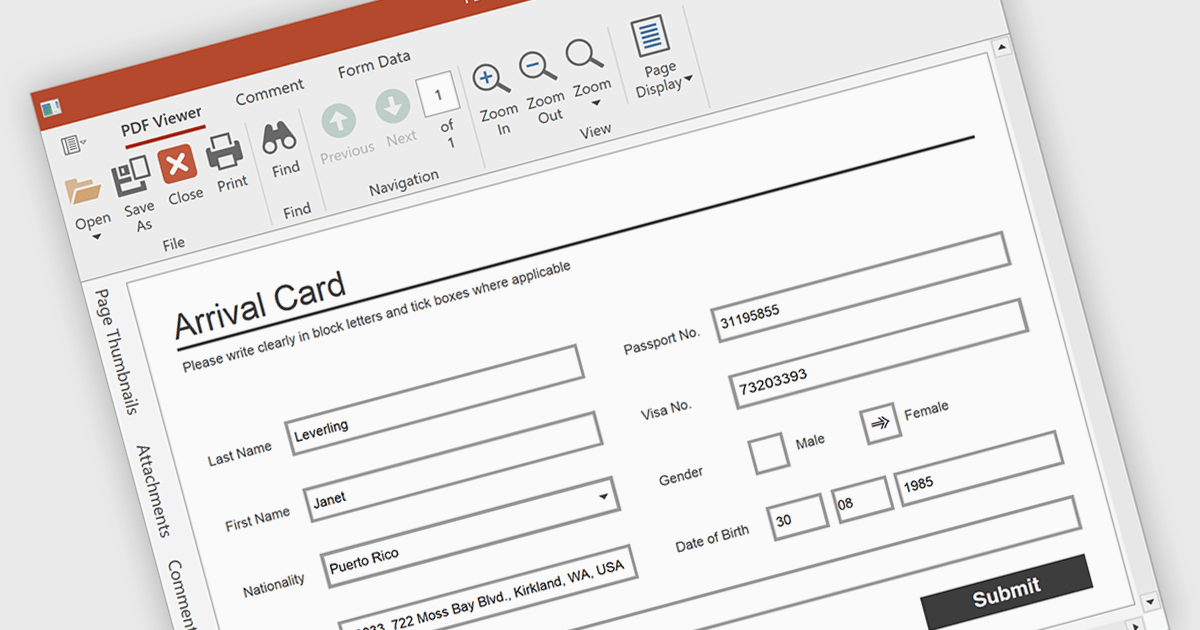
Form filling in a PDF Viewer enables users to interact with editable fields such as text boxes, checkmarks, radio buttons, and selection lists - right inside the document. This functionality is ideal for scenarios like contracts, surveys, and registration forms, where structured input is essential. By integrating these capabilities, developers can improve user interactions and allow form submission without leaving the application, enhancing data capture and eliminating the need for external tools.
Several WPF PDF Viewers feature support for form filling, including:
For an in-depth analysis of features and price, visit our comparison of WPF PDF viewers.
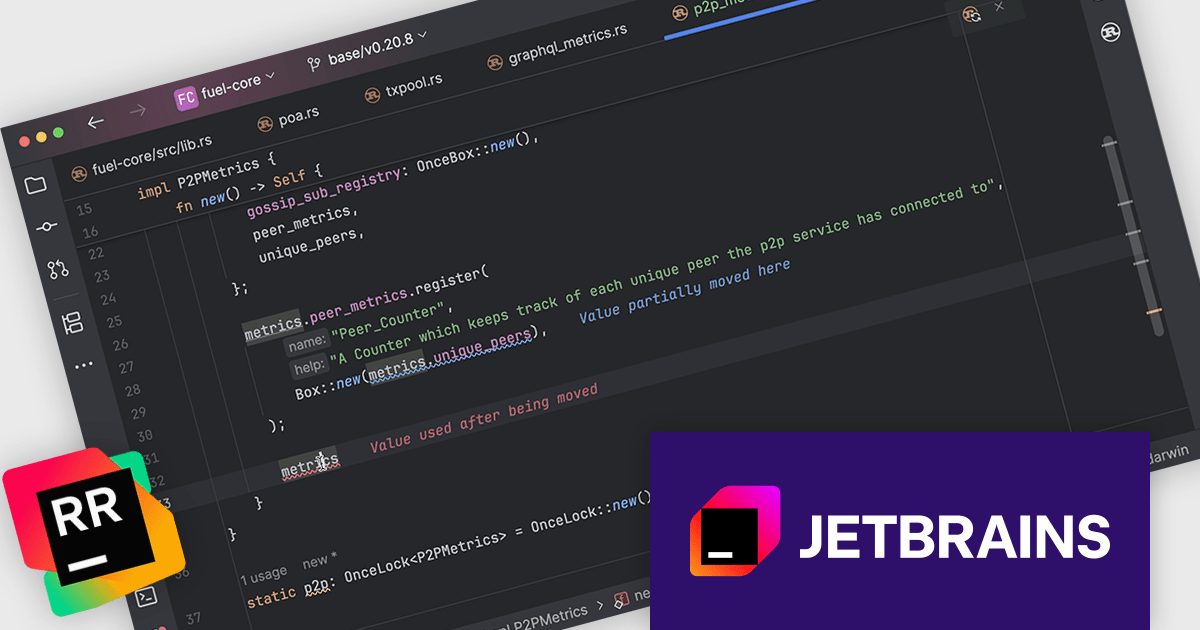
RustRover by JetBrains is a specialized integrated development environment (IDE) designed to support the unique needs of Rust developers. Built on JetBrains' IntelliJ platform, it combines deep language understanding with tools that enhance productivity, such as intelligent code completion, advanced code analysis, and robust refactoring capabilities. RustRover also integrates seamlessly with Cargo, Rust's package manager, and includes built-in support for testing and debugging to streamline the entire development workflow. By focusing on the requirements of performance-critical and memory-safe applications, RustRover helps developers write efficient, reliable, and maintainable Rust code with ease.
JetBrains has added a valuable update to RustRover with the introduction of color-coded inlay error descriptions. This feature adds concise error explanations directly in the code editor whenever the caret is positioned within an error's range. What sets this apart is the use of consistent color schemes that reflect different levels of severity, enabling developers to quickly distinguish between warnings, errors, and other diagnostics. This visual feedback simplifies error identification and supports faster debugging and code correction.
RustRover is licensed per user, and is available as a commercial annual subscription license. We can supply new subscriptions, subscription renewals, lapsed renewals, and additional user licenses. See our RustRover licensing page for full details.
RustRover is available to buy in the following products:
AlterNET Studio is a development toolkit designed specifically for .NET developers building Windows Forms or WPF applications. It provides a suite of components that integrate seamlessly into your applications, offering functionalities like advanced code editing with features akin to Microsoft Visual Studio, scripting capabilities in various languages for extending application logic, and a visual form designer for crafting user interfaces.
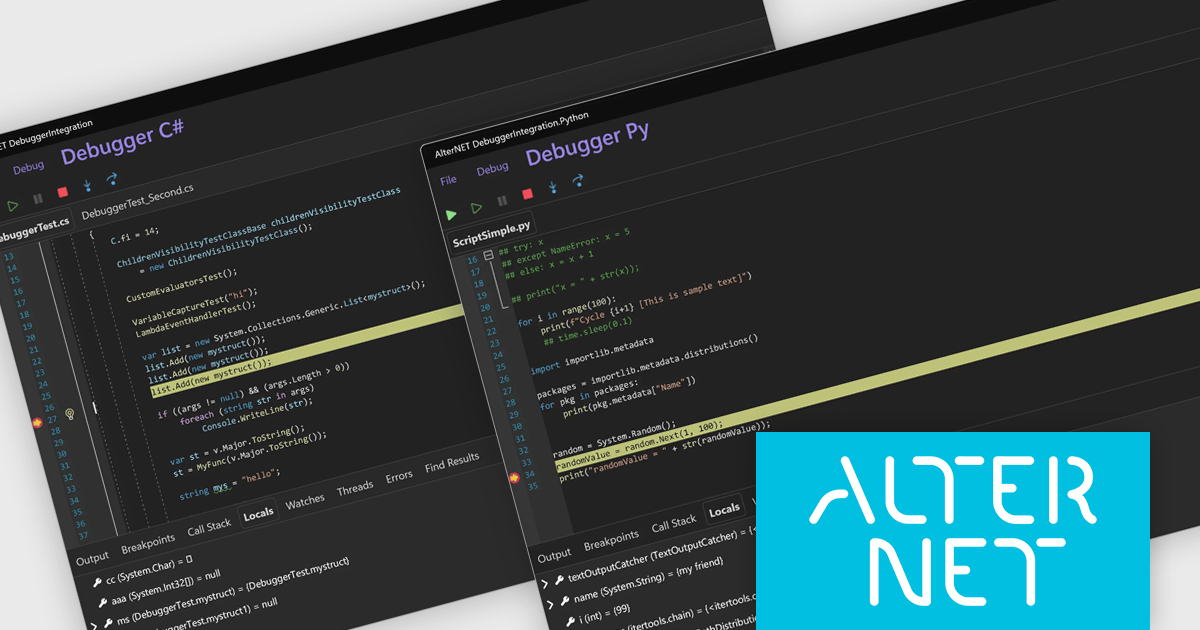
The AlterNET Studio v10 update introduces compatibility for C#, Visual Basic, and Python scripters and debuggers with macOS and Linux, allowing developers to build and debug cross-platform applications without being restricted to a Windows environment. By targeting .NET Standard 2.0, the non-visual components such as scripting engines and parsers are now usable across a broader range of platforms. Additionally, the inclusion of a debugger UI built with AlterNET UI and MAUI enables integration of modern, customizable debugging interfaces into cross-platform applications, improving development and enhancing productivity in multi-OS environments.
To see a full list of what's new in v10, see our release notes.
AlterNET Studio is licensed per developer. A license is only required when developing and compiling applications that use AlterNET Studio; end-users or testers of compiled applications do not require a license. The perpetual license includes a one-year subscription which entitles you to free updates to all new versions during the subscription period. See our AlterNET Studio licensing page for full details.
Learn more on our AlterNET Studio product page.
전화 : 00798 14 800 6332
팩스 : +1 770 250 6199


